About Stitch benchmarks
Stitch collects data that your brand has provided to Amperity, runs, and then outputs a series of tables that contain the results.
A “ground truth” dataset for your brand, against which Amperity can compare Amperity IDs to validate identity, does not exist and prevents using standard error metrics to evaluate the quality of Stitch output.
A benchmark check is a heuristic that defines how often Amperity IDs are expected to meet a certain condition. For example, Amperity expects no more than 0.011% of your Amperity IDs to be associated with more than three given names.
Each benchmark check measures the percentage of Amperity IDs meeting its respective condition and compares the result against the optimal range. A benchmark check result can fall into the optimal range, above the optimal range, or far above the optimal range (high).
For example, it is expected that most, but not all, Amperity IDs should not have more than three given names. It is possible for an Amperity ID to be correctly associated with more than three given names for valid reasons such as differences in data capture, the presence of typos, use of nicknames, or name changes. A higher-than-expected rate of Amperity IDs associated with more than three given names may be an indicator that Stitch is clustering records together too aggressively.
About benchmark results
Amperity uses benchmark checks to provide insight into the quality of your Stitch results. Results fall into one of the following categories:
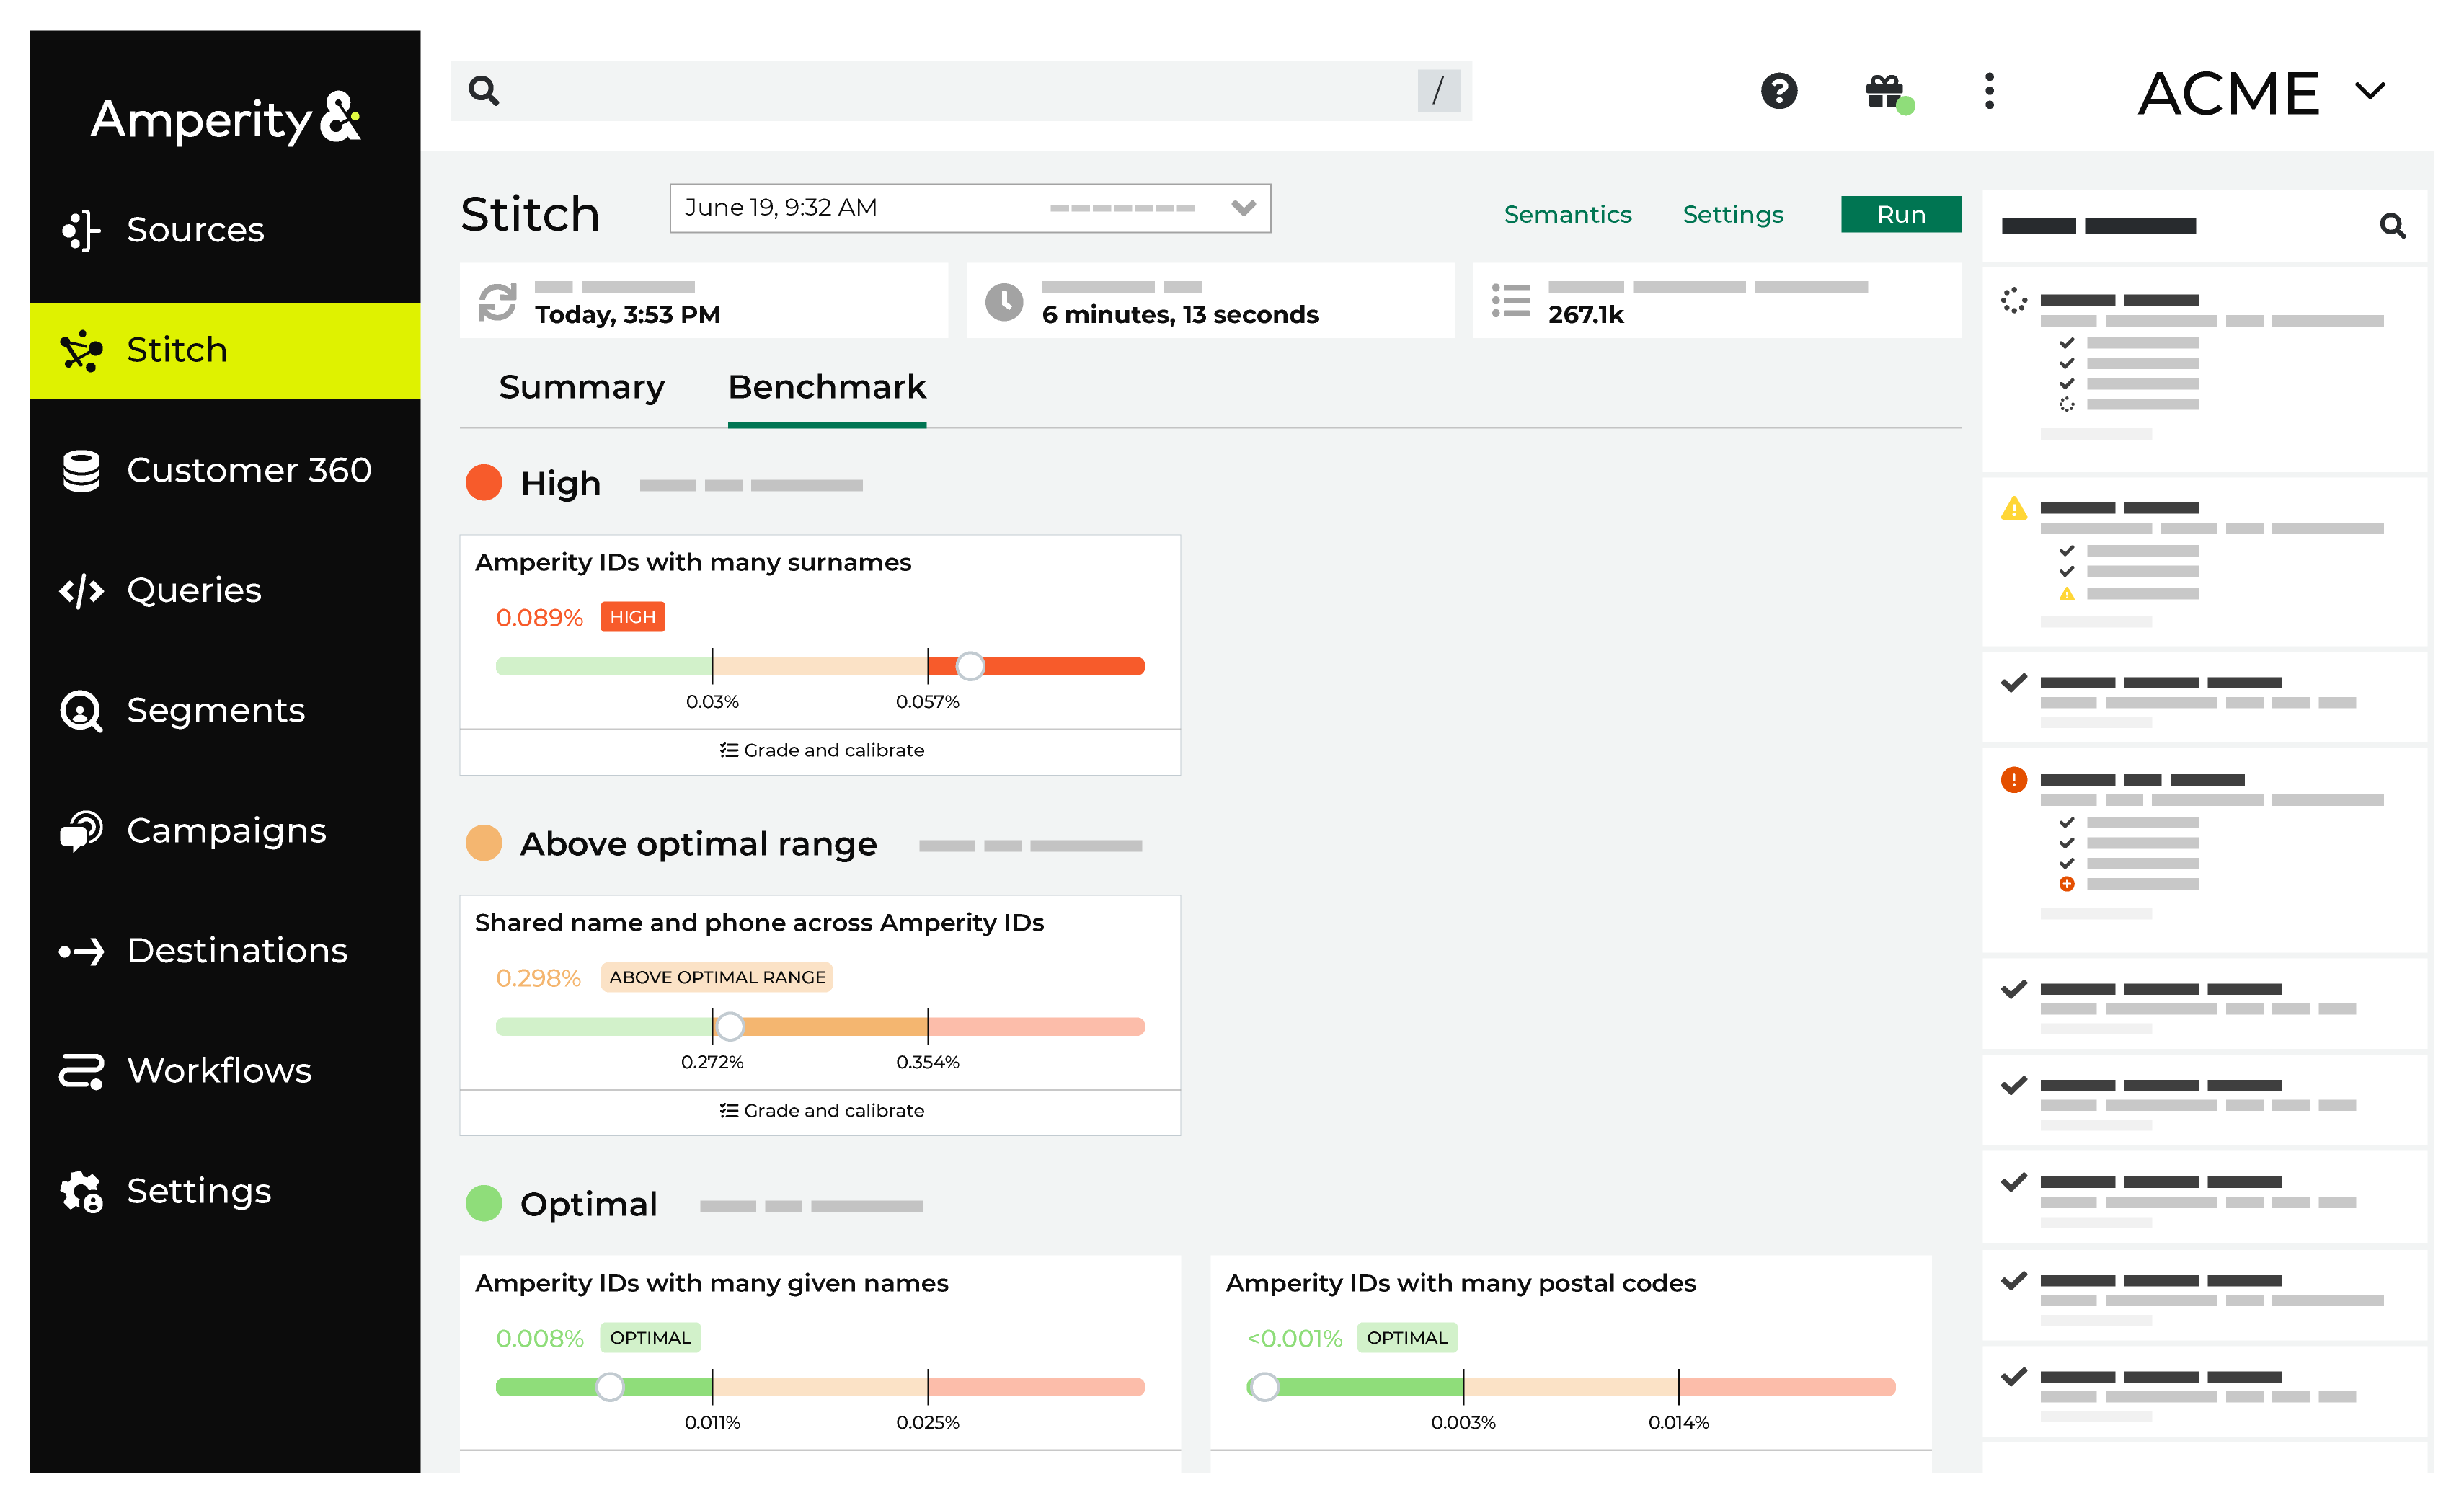
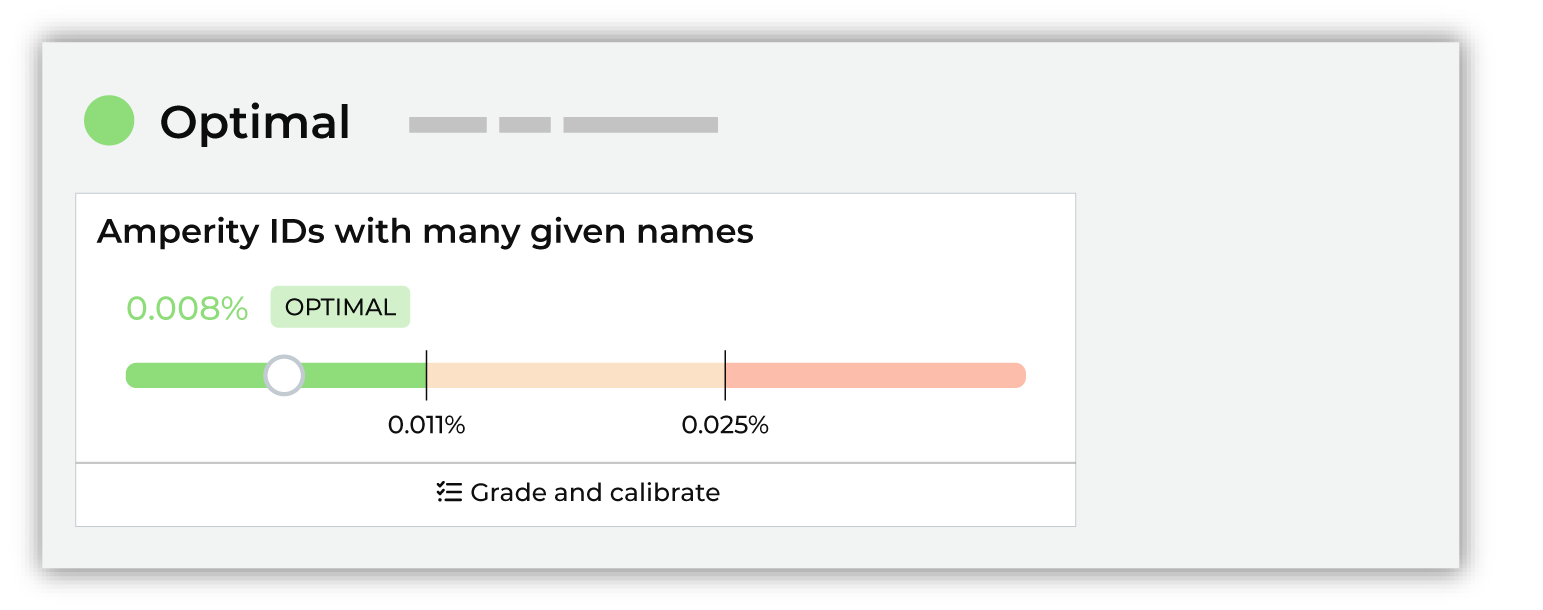
Optimal
Optimal results represent benchmark check results that fall within the expected range. These results can be “more optimal” and they can be “less optimal”.
For most tenants, most of the time, nothing needs to be done when benchmark checks are optimal. In some cases, it might be worth exploring if scores that fall on the edge of optimal scoring and are close to falling outside the optimal range can be improved.
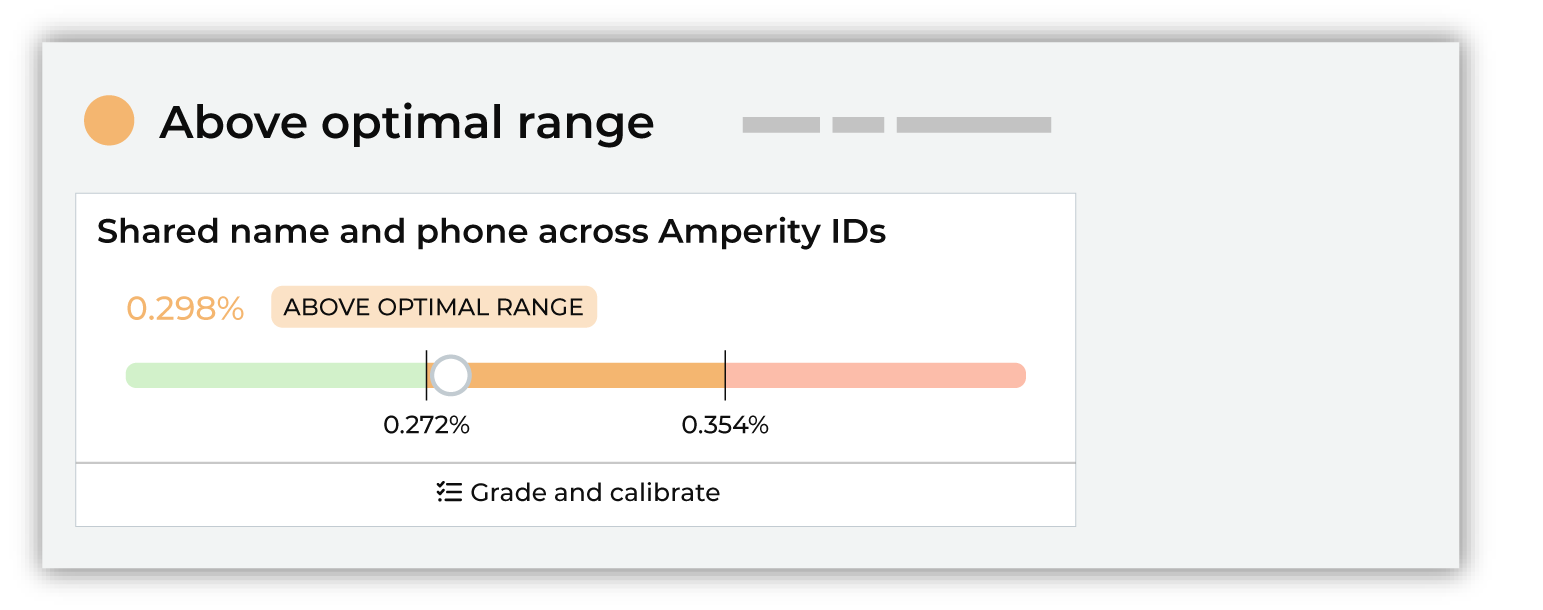
Above optimal range
Results that fall above the optimal ranges may be investigated, but it is often not necessary. Compare the history of the scores and determine if anything should be done to try to improve the benchmark results.
Was new data made available to your tenant? Were any changes made to Stitch configuration? Both of these may be the cause of scores falling above the optimal range.
In many cases nothing needs to be done with benchmark checks that fall above the optimal range beyond monitoring the result to see if it continues to increase or if it stabilizes.
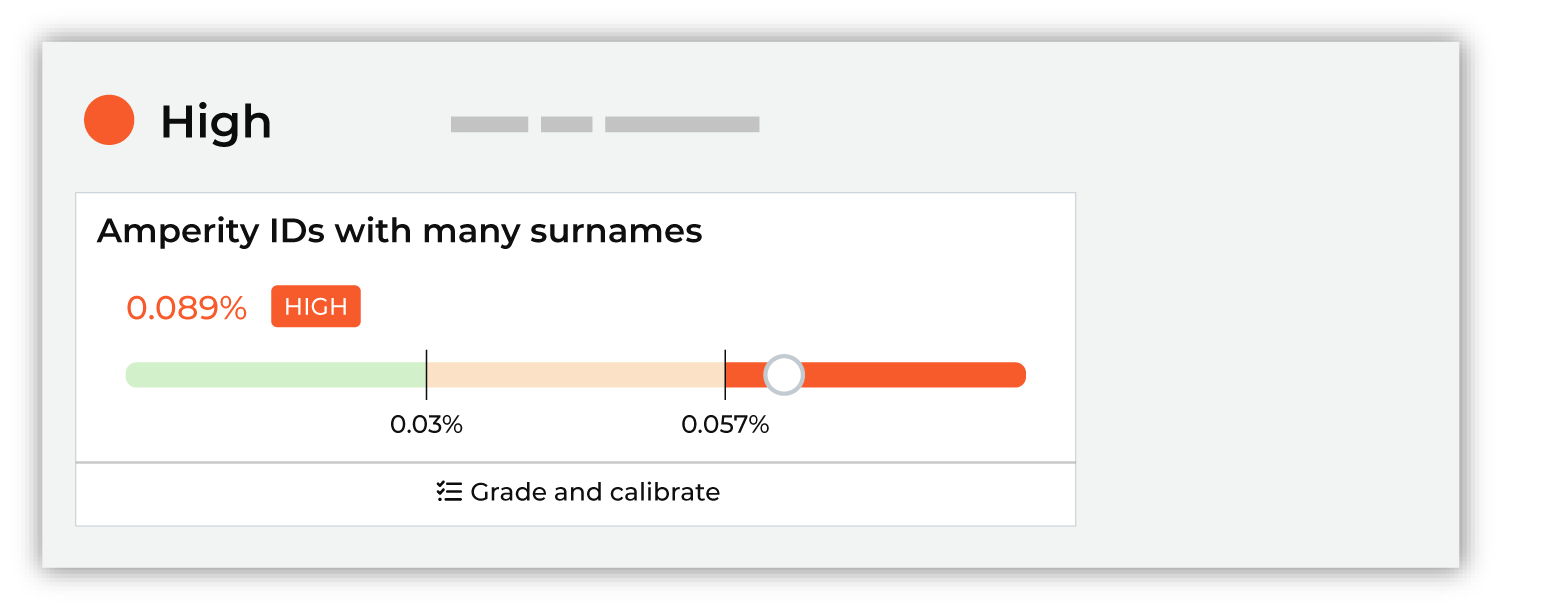
High
High results do not need to be fixed, but they should be investigated. In many cases, high results indicate that improvements to the quality of Stitch results can be made.
Review and grade the results for benchmark checks with high results by assigning thumbs up or thumbs down to the sample set of records, after which you should click Show recommendations, and then review the list of options that are available to help improve this particular benchmark result.
Important
Use a sandbox to make configuration changes to Stitch, and then compare the benchmark results in the sandbox to the high benchmark results in production. Also compare other benchmark results to determine if changes affected the overall quality of benchmark results.
Review interpretations
Interpretations are provided by each benchmark check. They describe the result and provide an explanation of how to interpret it. For example:
“This is above the expected range and may be an indication of overclustering. A large percentage indicates that different given names are appearing the same cluster, which indicates overclustering.”
or:
“This is far above the expected range and may be an indication of overclustering. A large percentage indicates that different postal codes are appearing the same cluster, which indicates overclustering.”
When a benchmark score is above the optimal range or high it is recommended to review and grade a set of 10 example clusters, after which the benchmark check will make a series of recommendations that can lead to improved benchmark results.
Grade and calibrate
All benchmark checks include example Amperity IDs that can be reviewed and graded. You should periodically review and grade examples for benchmark checks with high results. This helps ensure that Stitch is always building the highest quality customer profiles and can lead to incremental improvements over time.
Depending on the outcome of reviewing and grading benchmark check examples, a series of recommendations may be shown. Stitch configuration settings can be updated directly in the benchmark check.
How does Amperity choose which records are available for grading?
Amperity uses stratified random sampling to select the examples. A fresh set of examples is generated during each Stitch run.
All clusters (or groups of clusters) that are flagged by the check are collected.
For example, with the Amperity IDs with many surnames check, all clusters with more than 3 surnames are collected.
A rules-based approach is used to determine which of these clusters are likely to be “good” identity decisions and which are likely to be “poor” identity decisions.
The percentage of clusters that are likely to be “good” identity decisions and the percentage likely to be “poor” identity decisions are identified.
For example: 70% good, 30% poor.
10 examples are selected at random using the same rate of “good” and “poor” clusters.
For example, 7 records will represent “good” identity decisions and 3 records will represent “poor”.
Amperity will make a recommendation for when to rate each example as “good”, but cannot identify without input which examples in the random sample represent “good” or “poor” identity decisions.
Revisit benchmarks
You should revisit benchmark scores on a regular basis. The frequency is determined by the current state of your tenant. For example:
A newly configured tenant should have benchmark scores reviewed after every Stitch run. Reduce the frequency when you are satisfied with each benchmark score.
Review benchmark scores after adding a data source that has customer profile data that is used with identity resolution.
On a production tenant with consistent data sources you may revisit benchmark scores less often.
Benchmark categories
The following sections list benchmark checks by category:
Overclustering
An overcluster–a false positive–occurs when distinct records are incorrectly added to a cluster of records. Each overcluster affects the precision of identity resolution. Investigate to understand why they occur.
Stitch benchmark checks for overclustering evaluate situations where records that likely belong to two or more individuals end up being assigned the same Amperity ID. This can occur when records with different personally identifiable information (PII) are connected by a foreign key or by a small set of matching PII.
Many given names
The Amperity IDs with many given names benchmark computes the percentage of Amperity IDs with more than three given names.
A larger percentage implies that too many given names are being associated with the same Amperity ID at a higher-than-expected frequency.
Many postal codes
The Amperity IDs with many postal codes benchmark computes the percentage of Amperity IDs with more than five postal codes.
A larger percentage implies that too many postal codes are being associated with the same Amperity ID at a higher-than-expected frequency.
Many surnames
The Amperity IDs with many surnames benchmark computes the percentage of Amperity IDs with more than three surnames.
A larger percentage implies that too many surnames are being associated with the same Amperity ID at a higher-than-expected frequency.
Underclustering
An undercluster–a false negative–occurs when distinct records are incorrectly split from a cluster of records. Each undercluster affects the precision of identity resolution. Investigate to understand why they occur.
Stitch benchmark checks for underclustering evaluate situations where records that likely belong to the same individual end up being assigned different Amperity IDs. This can occur when records with similar personally identifiable information (PII) are separated by a separation key or by a small set of mis-matching PII.