Event propensity model
Event propensity is a predictive model that finds the likelihood that a customer performs a revenue-generating event within the next 30 days.
Use event propensity modeling to associate individual customers to specific events that, depending on the type of event, are most likely to lead to engagement with your brand. Customers are grouped by audience size and by ranking.
Use cases
The event propensity model enables support for marketing campaigns that benefit from knowing a customer’s likelihood to perform a revenue-generating event, including:
Recommended audience sizes
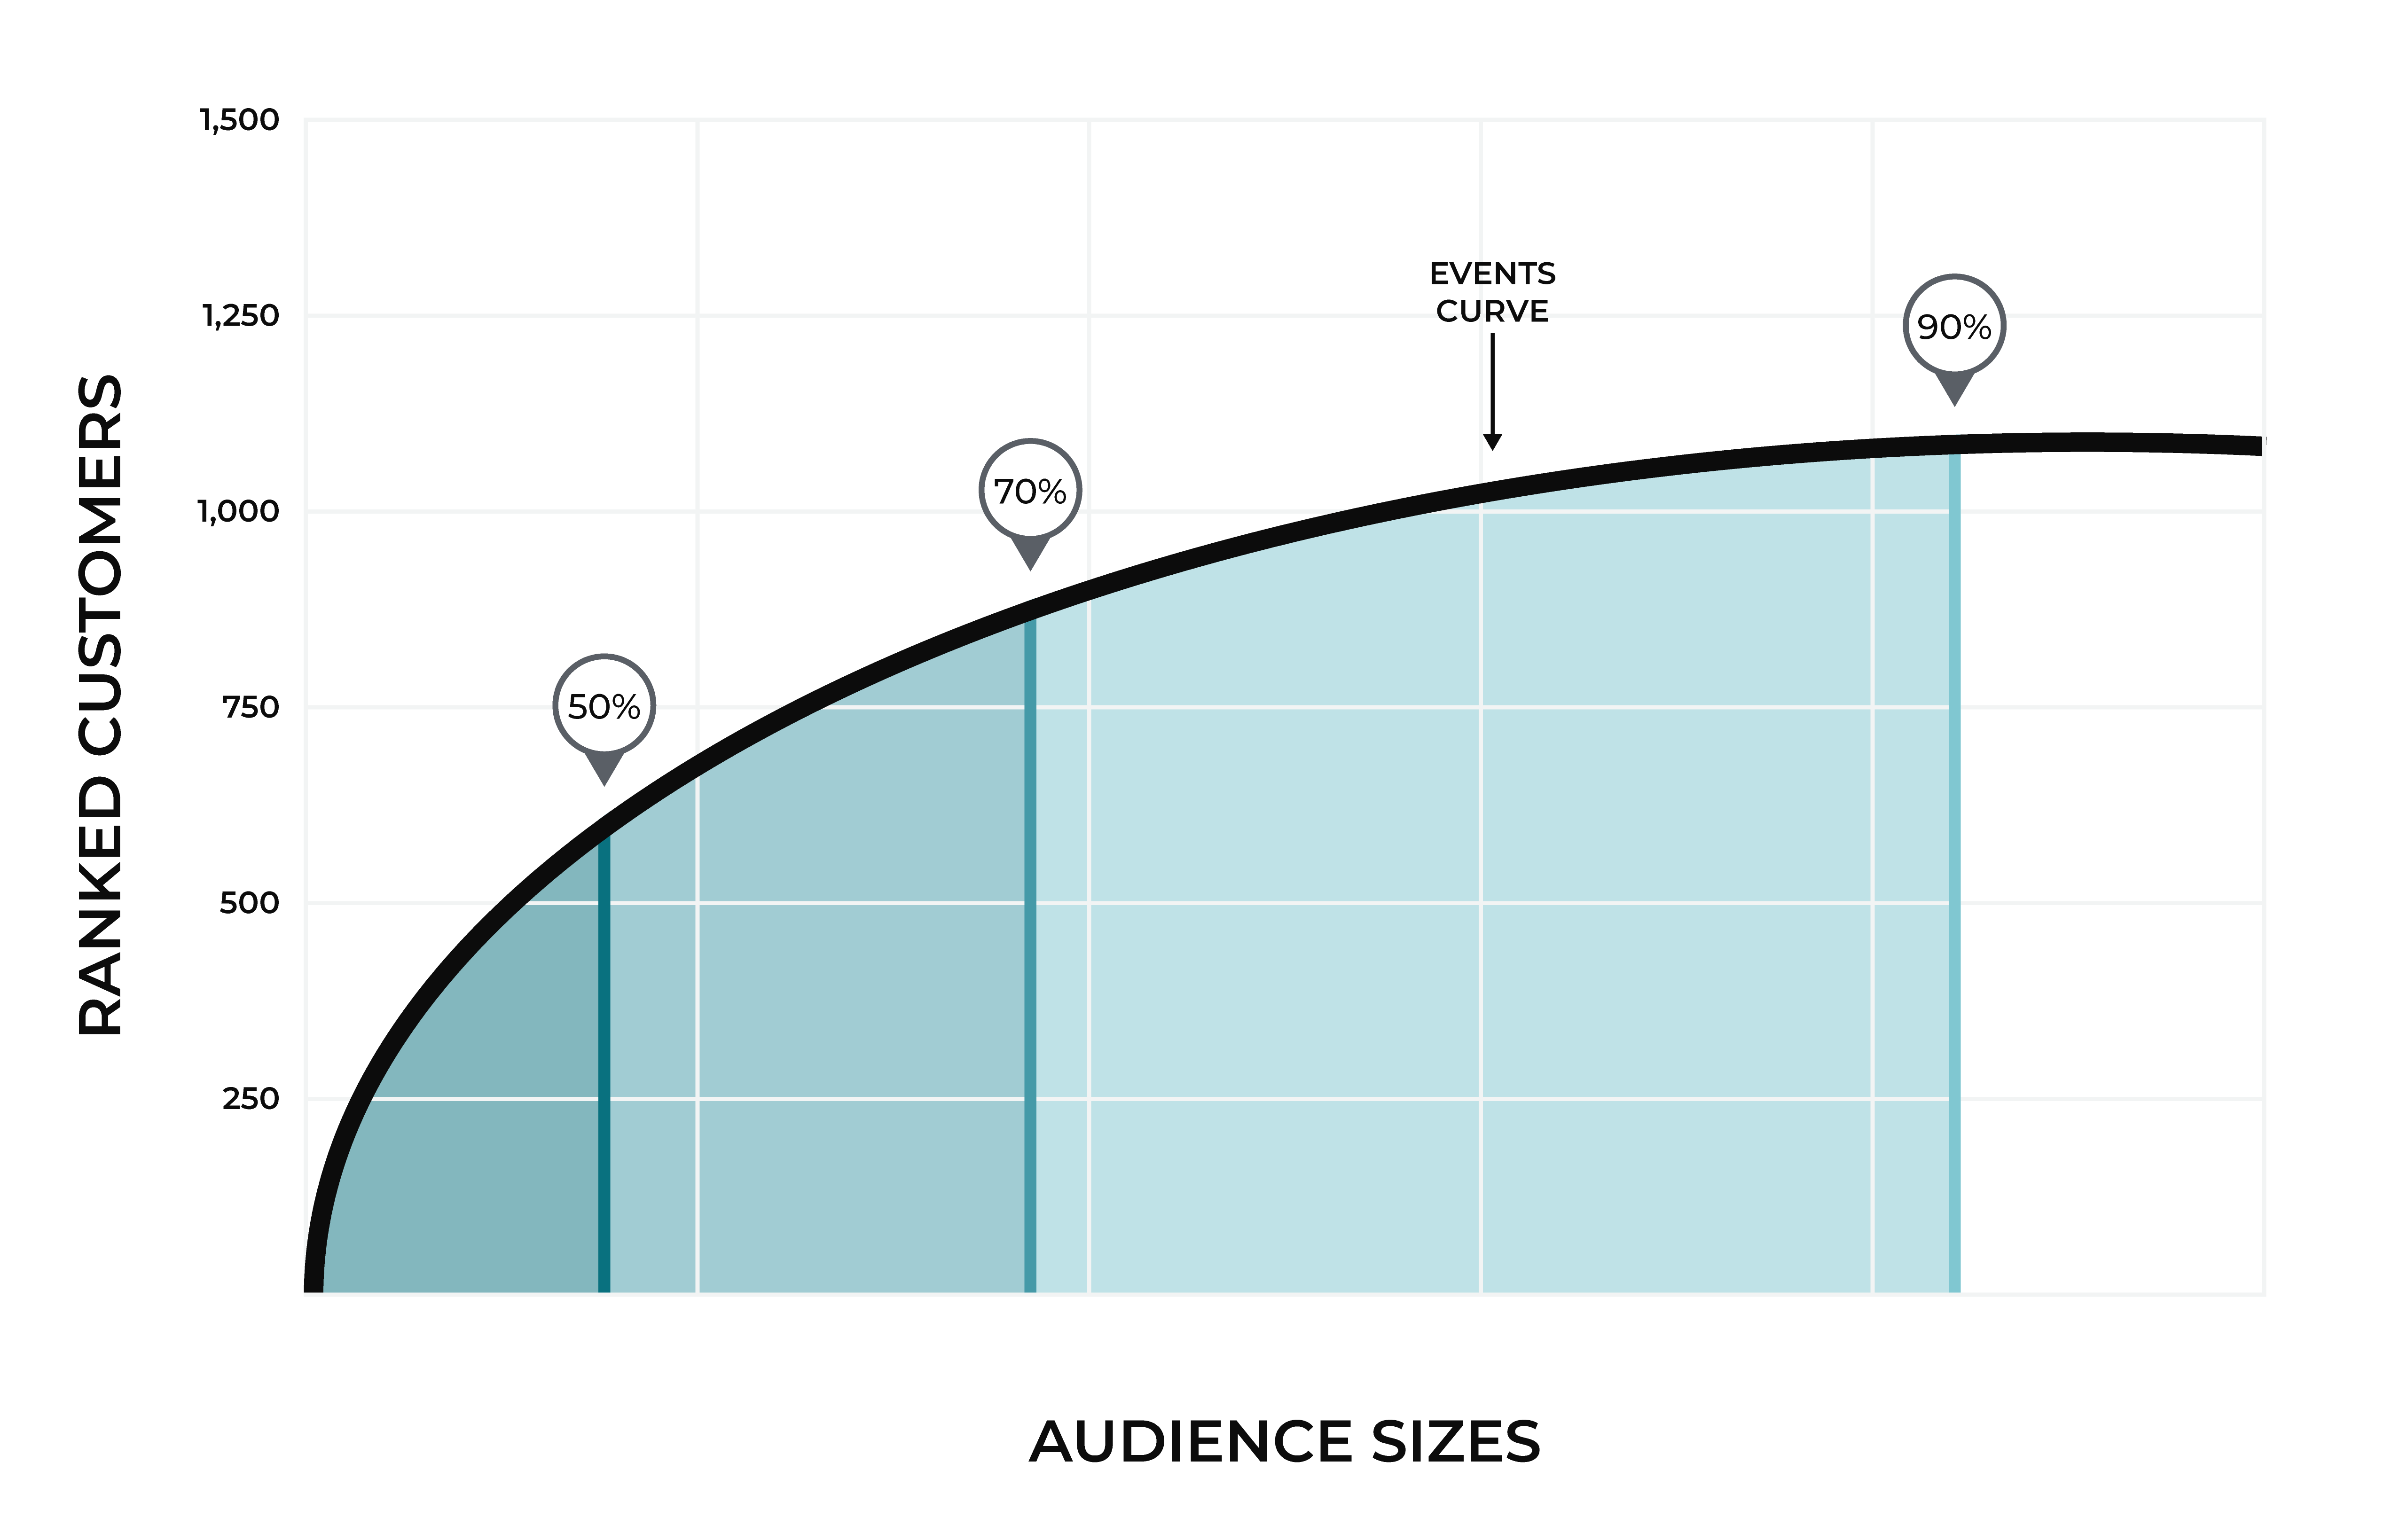
A recommended audience is a feature of product affinity modeling that answers the following question: “Which audience size grows revenue over the next 30 days?” Product affinity modeling answers this question with small, medium, and large recommended audience sizes. A recommended audience predicts future purchasers over the next 30 days.
Recommended audience sizes are calculated for 30-day window. An event curve is generated, along with corresponding audience sizes that show what size audience is required to capture 50%, 70%, and 90% of purchases for a given revenue-generating event during the previous 30 days.
Audience sizes are inclusive of all smaller audience sizes.
A medium audience size (70%) includes all of your customers who are in the small audience size (50%).
A large audience size (90%) includes all of your customers who are in the small and medium audiences.
Recommended audience sizes for event propensity modeling identify customers who are most likely to perform a revenue-generating event. Use recommended audience sizes to find customers who are likely to:
Join your brand’s loyalty program
Sign up for your brand’s credit card
Make a repeat booking for a car rental, airline ticket, or hotel stay
Attributes for recommended audience sizes are available from the Event Propensity table:
Attribute Name |
Description |
|---|---|
Audience Size Small |
A small audience is predicted to include ~50% of customers who are likely to perform a revenue-generating event. |
Audience Size Medium |
A medium audience is predicted to include ~70% of customers who are likely to perform a revenue-generating event |
Audience Size Large |
A large audience is predicted to include ~90% of customers who are likely to perform a revenue-generating event |
Combine these attributes with the Target Event attribute to build audiences for a specific revenue-generating event. You can access these attributes directly from the segment editor.
Customer ranking
Use customer ranking to define an audience using the top N customers. Use customer ranking as an alternate to recommended audience sizes when an audience is too large (or small) or if a recommended audience size is unavailable for a specific event.
The Ranking attribute in the Event Propensity table ranks customer scores by event. A rank that is less than or equal to X provides the top N customers with a propensity for this event. Combine this attribute with the Target Event attribute to build customer rankings for a specific revenue-generating event. You can access this attribute directly from the segment editor.
Build an event propensity model
You can build an event propensity model from the Customer 360 page. Each database that is a “customer 360” database and has the Merged Customers, Unified Itemized Transactions, and Unified Transactions tables may be configured for predictive modeling. You may use other tables in that database that are unique by Amperity ID to extend predictive models.
Important
EPM is highly configurable, with the only table used by default being Merged Customers. The model requires that you select two other data assets with event-level data: one containing the target event, and one containing a revenue generating event.
The target event is the event to model. For example: loyalty program signups, credit card signups, or repeat bookings. The data asset should have one row per event, and must have a field for the event’s date or timestamp.
A revenue generating event is an event in which a customer spends money with your brand. For example: a retail transaction or a booking. The data asset should also have one row per event, and must have fields for an event’s date or timestamp and revenue amount. You may also select other fields from the revenue generating event that you think would be helpful for modeling, such as a purchase or booking channel.
Additionally, you may configure custom events as further inputs to the model. Custom event data assets are also expected to be one row per event.
For revenue generating events and custom events, there are configuration options for the event’s timestamp, and also the event’s realization date. For events, such as bookings, where a customer pays money at one point in time, but then “realizes” or consumes the good or service at another point in time. Supply both fields to the model.
To build an event propensity model

|
Open the Customer 360 page, select a database, and then open the bottom– –menu and select Predictive models. This opens the Predictive models page. |
|
Next to Event propensity, click Add model. Assign a name to the event for which event propensity modeling will be built, and then click Continue. This opens the Predictive enablement page for event propensity models. |
|
Configure the target event.
|

|
Use the Customer exclusions field to use fields in the Customer Attributes table to identify customers who have purchase patterns that should be excluded from event propensity modeling. For example, use cases for customer exclusions include:
Note The list of fields in the Customer Attributes table that may be used for event propensity modeling are listed in the dropdown. Not all fields in the Customer Attributes table may be used with event propensity modeling. |

|
Configure revenue events.
|

|
Use the Additional event field to add more events to the event propensity model. For each additional event, select an event table, and event date field, and additional features in that table that should be associated to the event. |

|
Click Start validation. |
Use in segments
The following table describes the fields that are available when using event propensity modeling in segments.
Column name |
Data type |
Description |
|---|---|---|
Amperity ID |
String |
The unique identifier assigned to clusters of customer profiles that all represent the same individual. The Amperity ID does not replace primary, foreign, or other unique customer keys, but exists alongside them within unified profiles. Note The Amperity ID is a universally unique identifier (UUID) that is 36 characters spread across five groups separated by hyphens: 8-4-4-4-12. For example: 123e4567-e89b-12d3-a456-426614174000
|
Audience Size Large |
Boolean |
A flag that indicates the recommended audience size. When this value is A large audience size is predicted to include ~90% of future purchasers and to include a high number of non-purchasers. |
Audience Size Medium |
Boolean |
A flag that indicates the recommended audience size. When this value is A medium audience size is predicted to include ~70% of future purchasers and to include a moderate number of non-purchasers. |
Audience Size Small |
Boolean |
A flag that indicates the recommended audience size. When this value is A small audience size is predicted to include ~50% of future purchasers and to include the fewest number of non-purchasers. Use a small audience size to help prevent wasted spend and to reduce opt-outs. |
Ranking |
Integer |
A ranking of customers by score for this event. A rank that is less than or equal to X provides the top N customers with an propensity for this event. |
Score |
Float |
The strength of a customers’s propensity for this event, shown as an uncalibrated probability. Tip The score is used internally by Amperity, does not directly correlate to ranking or audience size, and should not be used in segments. Sort results by Ranking, and then compare those results to audience sizes. Higher rankings within smaller audience sizes correlate with higher propensity. |
Target Event Name |
String |
The name of the target event used with a event propensity model. |