Product affinity model
Product affinity is a predictive model that identifies which customers are likely to purchase next using a combination of historical purchase data and lookalike audiences. The predicted affinity model outputs a database table with a ranked list of customers by product affinity and three recommended audience sizes.
About product affinity models
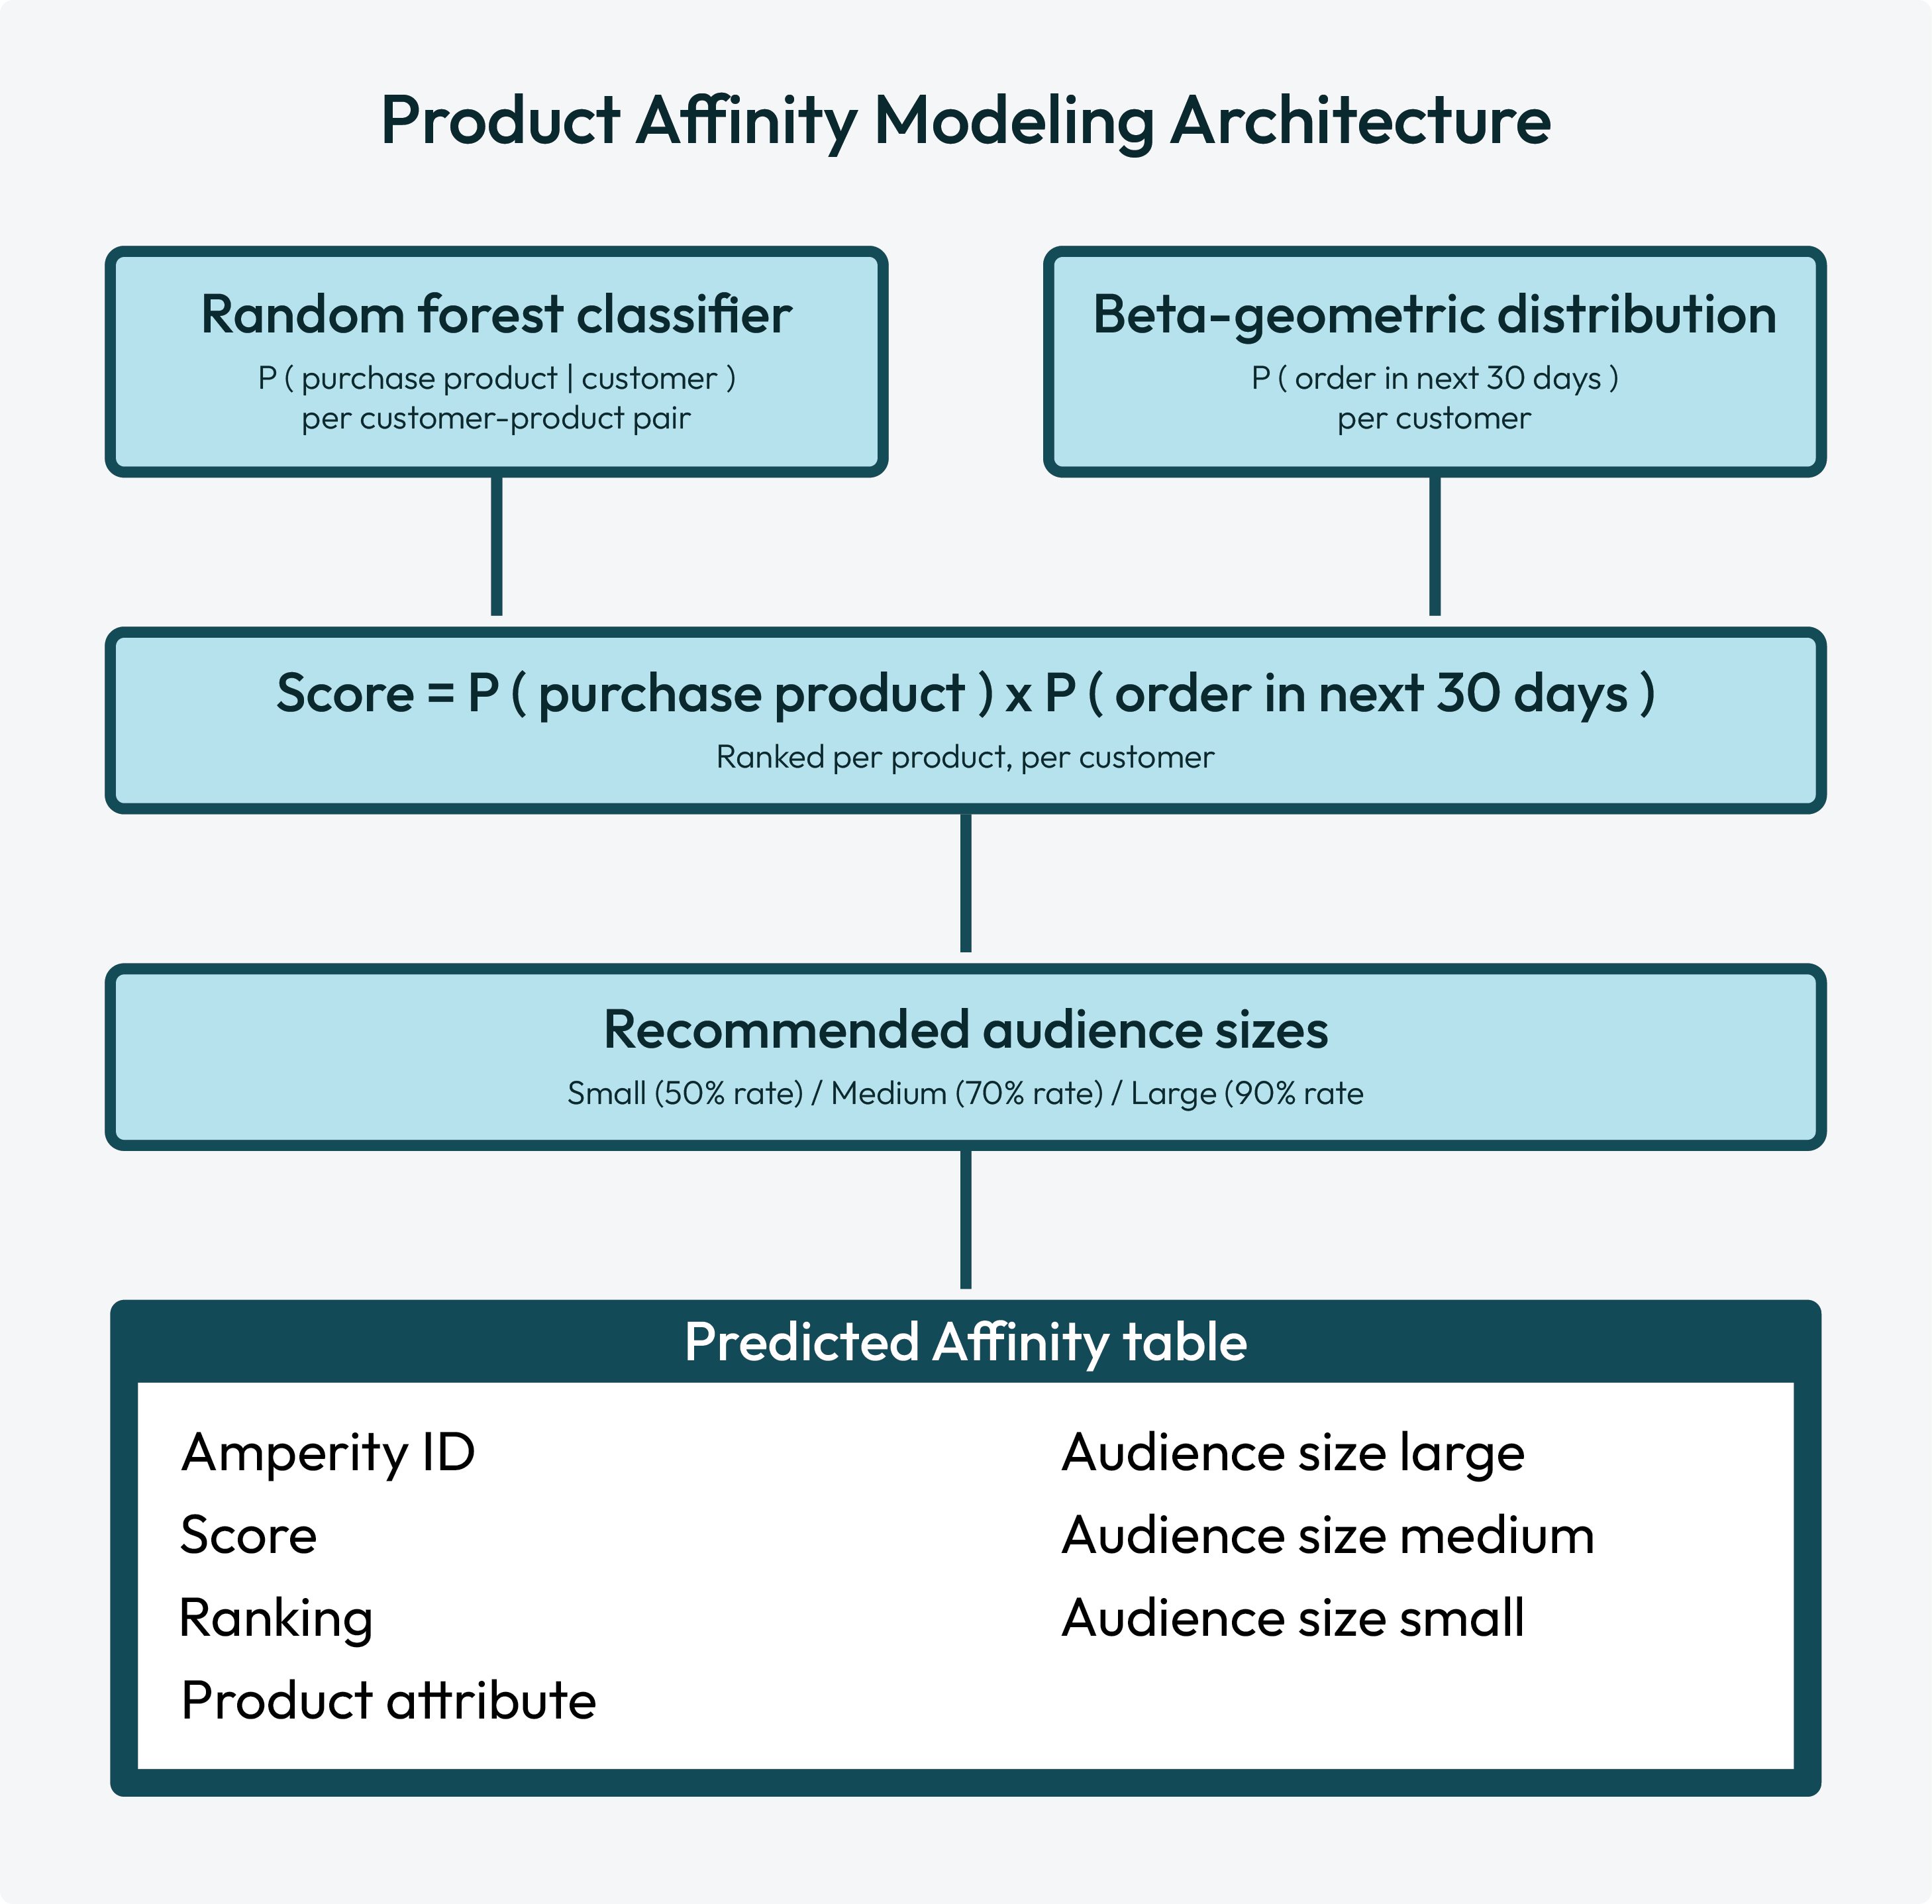
Product affinity models predict which products customers are most likely to purchase next. The model combines two components: a random forest classifier and a beta-geometric distribution.
For each product attribute, such as a product category, brand, or product subcategory, the model scores every customer-product pair, and then:
Ranks products for each customer by product affinity.
Recommends audience sizes for each product based on how model predictions match actual purchase behaviors.
How product affinity works
The product affinity model is an ensemble learning method with two independently trained submodels: a random forest classifier and a beta-geometric distribution. Each individual model contributes to the product affinity model’s output: product affinity scores.
Random forest classifier
A random forest classifier is an ensemble learning method for predictive affinity modeling. It learns historical purchase patterns, and then predicts the probability of customer purchases by product within a prediction window.
The random forest classifier for predictive affinity modeling predicts the probability of each customer purchasing each product attribute value, such as “shoes”, “outerwear”, or “shirts”, within the prediction window.
The random forest classifier learns patterns from historical customer purchases, such as:
What products were purchased?
When was the most recent purchase?
Through which channel was a purchase made?
How do the products purchased relate to products purchased by similar customers?
The random forest classifier outputs a score between 0 and 1 for each customer-product pair.
Note
Hyperparameters for the random forest classifier are configured during model version setup.
Beta-geometric distribution
A beta-geometric distribution is a statistical calibration layer for predictive affinity modeling that estimates the probability that a customer will purchase within the next 30 days based on purchase recency and purchase frequency.
The calibration layer helps ensure that customers without purchases during the previous 2 years have scaled-down product affinity scores, even when their historical product preferences are strong.
Note
Hyperparameters for beta-geometric distribution cannot be modified.
Product affinity scores
Every customer-product pair is assigned a product affinity score, where:
Score = P ( purchase product | customer ) x P ( order in next 30 days )
Customers are ranked by score for each product. Top-ranked customers are assigned to recommended audiences.
Audience size predictions
Top-ranked customers are assigned to recommended audiences as an output of product affinity scoring.
A recommended audience is a feature of product affinity modeling that answers the following question: “Which audience size grows revenue over the next 30 days?” Product affinity modeling answers this question with small, medium, and large recommended audience sizes. A recommended audience predicts future purchasers over the next 30 days.
The percentages for audience sizes are configurable as hyperparameters during initial model version setup.
Use cases
Product affinity modeling enables support for marketing campaigns that would benefit from knowing customer preferences across product categories with:
Audience sizes
A recommended audience is a feature of product affinity modeling that answers the following question: “Which audience size grows revenue over the next 30 days?” Product affinity modeling answers this question with small, medium, and large recommended audience sizes. A recommended audience predicts future purchasers over the next 30 days.
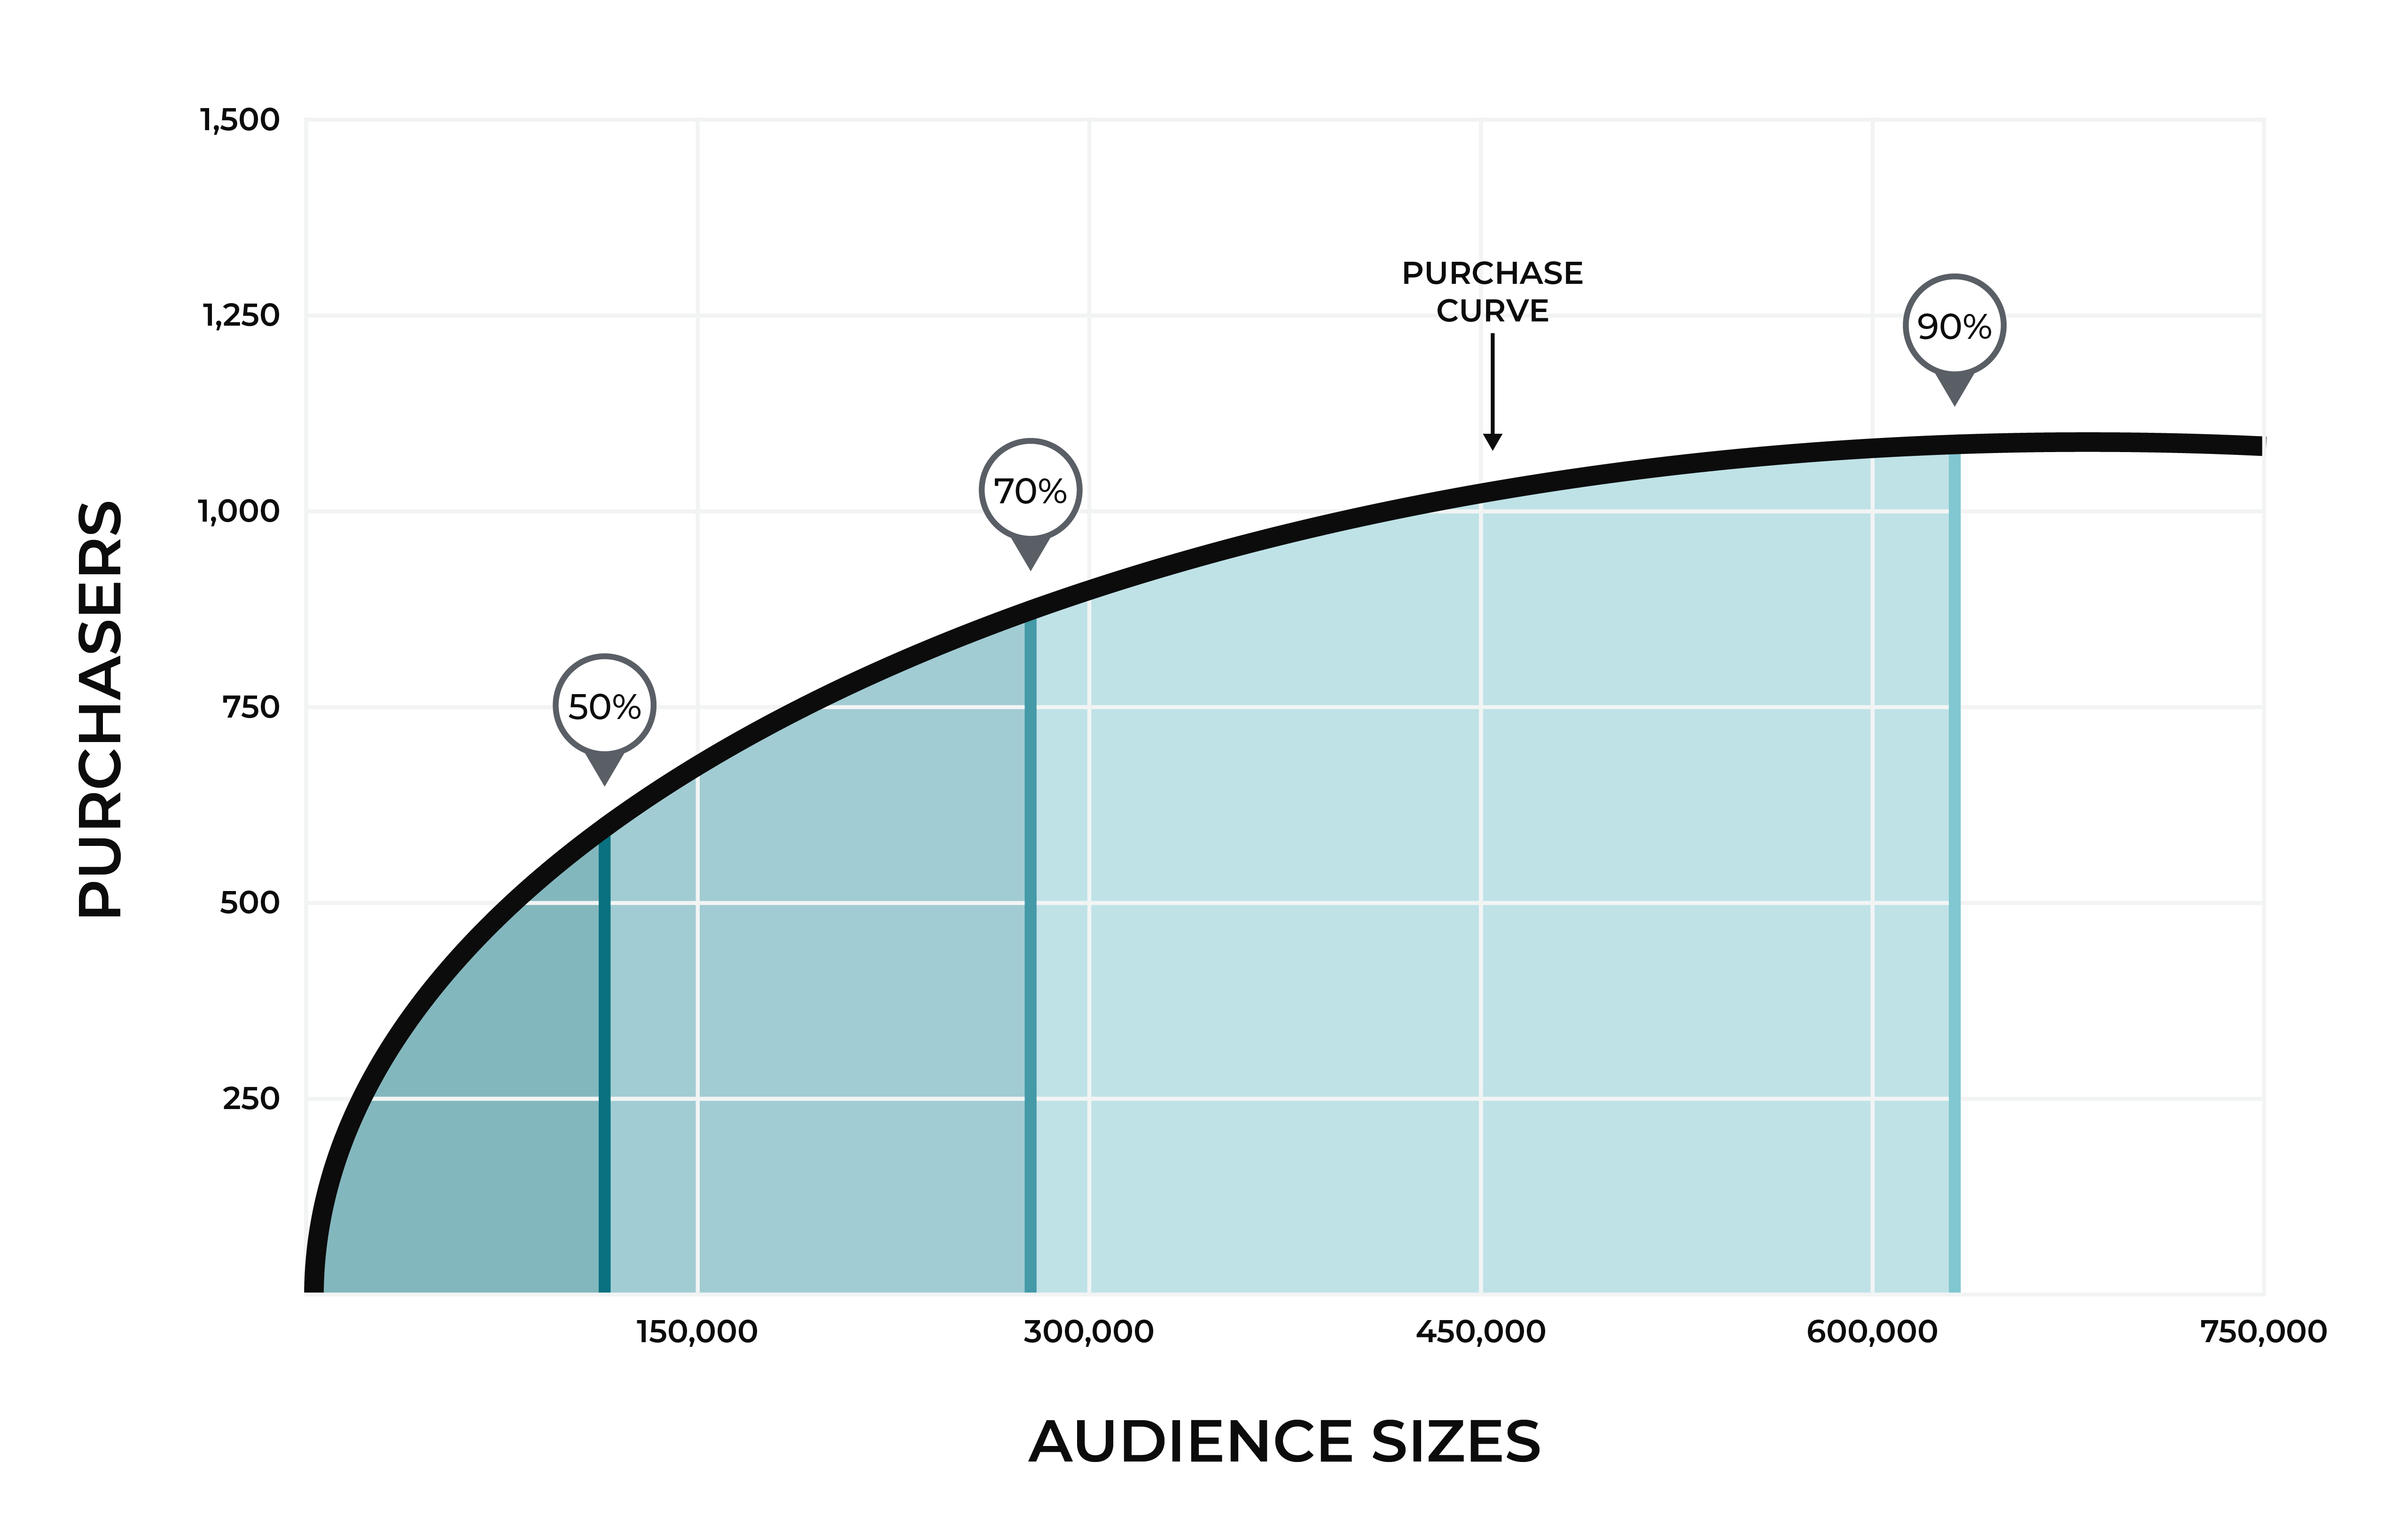
Recommended audience sizes are calculated using customer transaction data over a 30-day window. A purchase curve is generated, along with corresponding audience sizes that show what size audience would have been required to capture 50%, 70%, and 90% of purchases for a given product over the previous 30 days.
Audience sizes are inclusive of all smaller audience sizes.
A medium audience size (70%) includes all of your customers who are in the small audience size (50%).
A large audience size (90%) includes all of your customers who are in the small and medium audiences.
Recommended audience sizes identify customers who are most likely to purchase. Use recommended audience sizes to:
Engage with customers for product-specific sends, such as clearance sale and new arrival announcements
Define more valuable campaigns to grow revenue for specific product categories
Drive up conversion rates
Drive down opt-outs
Determine categories, products, and trends that resonate with key segments
Attributes for recommended audience sizes are available from the Predicted Affinity table:
Attribute Name |
Description |
|---|---|
Audience Size Small |
A small audience size is predicted to include ~50% of future purchasers and to include the fewest number of non-purchasers. Tip A small audience size helps prevent wasted spend and reduces opt-outs. |
Audience Size Medium |
A medium audience size is predicted to include ~70% of future purchasers and to include a moderate number of non-purchasers. |
Audience Size Large |
A large audience size is predicted to include ~90% of future purchasers and to include a high number of non-purchasers. |
Combine audience size attributes with product attributes to build audiences for a specific product categories, classes, or brands. Access these attributes directly from the Segment Editor.
Customer ranking
Use customer ranking to define an audience using the top N customers. Use customer ranking as an alternate to recommended audience sizes when an audience is too large (or small) or if a recommended audience size is unavailable for a specific product or category.
Customer ranking identifies the top N customers who are most likely to purchase. Use customer ranking to:
Provide an alternative to a recommended audience size, such as when a recommended audience size is unavailable for a specific product or category
Serve targeted product messages to defined audiences
Identify first-time buyer personas
Drive up conversion rates
Drive down opt-outs
The Ranking attribute in the Predicted Affinity table ranks customer scores by product. A rank that is less than or equal to X provides the top N customers with an affinity for this product. Combine this attribute with the Product Attribute attribute to build customer rankings for a specific product category, class, or brand.
Build a product affinity model
You can build a product affinity model from the Customer 360 page. Any database that has the Merged Customers, Unified Itemized Transactions, and Unified Transactions tables may be configured for predictive modeling.
Important
The following fields are automatically included in all predictive models:
Table |
Fields |
|---|---|
Merged Customers |
Predictive models always use the following fields in the Merged Customers table:
|
Unified Transactions |
Predictive models always use the following fields in the Unified Transactions table:
The following fields, when they are available in the Unified Transactions table, will also be used:
|
Unified Itemized Transactions |
Predictive models always use the following fields in the Unified Itemized Transactions table:
|
To build a product affinity model
Select model, create version
Open the Customer 360 page and select a database. Click the menu to open the menu, and then select Predictive models. This opens the Predictive models page.
Click the Add model button and select Product Affinity. In the New model dialog assign a name to the model and add a description.
Choose field for predictions
Product affinity modeling helps expand audiences by focusing on customers who are most likely to purchase. Choose product attributes aligned to marketing campaigns for new product launches or product-specific sales and promotions.
Product affinity modeling uses a single field to predict customer preferences. The field for predicting customer preferences may be used with a single product affinity model.
In the New model dialog, from the Product group dropdown select a field from the Unified Itemized Transactions table for predicting customer preferences. For example, Product Category, Product Subcategory, or Brand.
Caution
The value for Product group is set at model creation and cannot be changed. Create a new model to change the value for Product group.
After choosing a field for predicting customer preferences, click Create. This opens the New version dialog.
Define version settings
The New version dialog has two tabs: General and Advanced.
Select the General tab to configure the list of values for predicting product affinity. The list of values can be managed by rules or be managed manually.
Option |
Description |
|---|---|
Use rules |
Select Rules to build a list of values automatically up to the configured maximum number of values. Use the Max product groups field to configure the maximum number of values for the selected field. The default value is “50”. Values must have at least 100 purchases during the previous 30 days and at least 250 purchases during the previous 365 days to be included in product affinity model output. Tip Use the Show ineligible slider to view values that do not meet the minimum thresholds for rules-based inclusion in product affinity modeling output. |
Manually |
Select Manual to choose the list of values included in model output. Only selected values with at least 100 purchases during the previous 30 days and at least 250 purchases during the previous 365 days are included in product affinity modeling output. |
Caution
Do not click Evaluate until after hyperparameters for the random forest classifier are configured unless you intend to use the default values for hyperparameters.
Configure hyperparameters
A random forest classifier is an ensemble learning method for predictive affinity modeling. It learns historical purchase patterns, and then predicts the probability of customer purchases by product within a prediction window.
Select the Advanced tab to configure hyperparameters for the random forest classifier. When finished, click Evaluate.
Important
Hyperparameters for the random forest classifier are only configurable during initial version setup.
The random forest classifier has the following hyperparameters:
Parameter |
Default |
Description |
||||||||||||
|---|---|---|---|---|---|---|---|---|---|---|---|---|---|---|
Audience size definitions |
0.5, 0.7, 0.9 |
The sizes for small (0.5), medium (0.7), and large (0.9) audiences. Expand Audience size definition to change these definitions. |
||||||||||||
Customer exclusions |
None |
A list of fields from the Customer Attributes table. Customer profiles that match a selected field from the Customer Attributes table are excluded from recommended audiences. |
||||||||||||
Feature subset strategy |
Square root |
The random forest classifier is intentionally trained on a random subset of features at each split to ensure that each tree within the random forest is different. The value for Feature subset strategy determines how features are split into random subsets. Possible values:
|
||||||||||||
Max bins |
700 |
The maximum number of bins for discretization of continuous features . Before a tree is split on a continuous feature, such as Product Subcategory, the random forest classifier must decide where to try splitting. This setting defines the maximum number of candidate thresholds within a dataset the random forest classifier is allowed to evaluate before splitting data. For example, with a very low number of bins, such as 10, the random forest classifier may try for ten evenly spaced splits. More bins gives the random forest classifier more ways to find precise splits. Max bins is the maximum number of bins available. Some values are grouped together when the number of possible splits exceeds the maximum number of bins. If a feature has fewer unique values than the Max bins value, the bin count is irrelevant. The random forest classifier evaluates every unique value as a candidate for splitting. The Max bins value constrains features with high cardinality or features that are truly continuous. Leaving Max bins set to 700 for a feature with 12 unique values results in 12 candidates for splitting. Note The maximum number of distinct values for a feature is 695, which is below the default Max bins value of 700. |
||||||||||||
Max depth |
5 |
The maximum depth of each tree in the random forest classifier. This setting controls the levels of splits a tree is allowed to make. At each level a yes or no question is asked and, depending on the answer, the data is split into two groups. For example: Tree: Age > 30?
|__ Yes. Purchases > 3? < depth 1
| |__ Yes. Socks? < depth 2
| | |__ Yes. Brand = Socktown? < depth 3
| | | |__ Yes. < depth 4
| | | | |__ Yes. Color = blue? < depth 5
| | | | |__ No. < depth 5
| | | |
| | | |__ No. < depth 4
| | |
| | |__ No. < depth 3
| |
| |__ No. < depth 2
|
|__ No. < depth 1
|
||||||||||||
Number of trees |
100 |
The number of individual trees available to the random forest classifier. More trees create more stable and more accurate random forest classifier outcomes. Start with 100 trees and increase or decrease this number during model evaluation to determine which number creates the best outcomes. |
Evaluate versions
Each version must be evaluated before it can be selected for use with product affinity modeling.
Tip
Review the validation results, especially for improvements to precision, recall, and outperformance for audience sizes. A model version should not be deployed when precision is less than 10% or when three out of four recall values underperform the naive baseline of historical purchasers.
Metric |
Description |
|---|---|
Evaluation |
Did model evaluation pass or fail? |
Precision |
A percentage that shows how this model version compares to random sampling. |
Recall |
A percentage that shows how actual purchasers in this model version compare to the naive baseline of historical purchasers. Note The naive baseline of historical purchasers is everyone who has previously purchased the product within the 450-day training window. Recall is shown for the model version and by audience size when recommended audiences outperform the naive baseline by capturing lookalike buyers who have no prior purchase history.
|
Choose version
Choose the version that performs best for product affinity modeling, and then click the Edit button.
On the Schedule page:
Set Status to Active.
Important
Only activate a version that performs best for your marketing use cases.
From the Courier group dropdown select a courier group. Active product affinity models must be attached to a courier group.
Inference cadence is the frequency at which predictions are generated. Under Inference refresh set the frequency. The default value is 1, which refreshes predictions daily.
Training cadence is the frequency at which product affinity modeling is retrained with new data. Under Training refresh set the frequency. The default value is 14, which retrains with new data every two weeks.
Click Save to activate the product affinity model. A full workflow starts that trains the model, runs inference, and then adds product affinity output tables to the database.
Product affinity output tables
When you activate a product affinity model a training and inference workflow begins. The product affinity model trains on 450 days of historical purchase data. The random forest classifier applies a 365-day exponential half-life decay for historical purchases to ensure that more recent purchases count more.
When the training and inference workflow finishes, an output table is generated with one row for each customer-product pair, and then added automatically to the database.
The name of the output table includes the table name–Predicted_Affinity–followed by the name of the field used for predicting customer preferences in Pascal case and separated by an underscore. For example, if the field used for predicting customer preferences is Product Category the name of the table is Predicted_Affinity_ProductCategory.
A Predicted Affinity table has the following columns:
Column name |
Data type |
Description |
|---|---|---|
Amperity ID |
String |
The unique identifier assigned to clusters of customer profiles that all represent the same individual. The Amperity ID does not replace primary, foreign, or other unique customer keys, but exists alongside them within unified profiles. Note The Amperity ID is a universally unique identifier (UUID) that is 36 characters spread across five groups separated by hyphens: 8-4-4-4-12. For example: 123e4567-e89b-12d3-a456-426614174000
|
Audience Size Large |
Boolean |
A flag that indicates the recommended audience size. When this value is A large audience size is predicted to include ~90% of future purchasers and to include a high number of non-purchasers. |
Audience Size Medium |
Boolean |
A flag that indicates the recommended audience size. When this value is A medium audience size is predicted to include ~70% of future purchasers and to include a moderate number of non-purchasers. |
Audience Size Small |
Boolean |
A flag that indicates the recommended audience size. When this value is A small audience size is predicted to include ~50% of future purchasers and to include the fewest number of non-purchasers. |
Product Attribute |
String |
The field against which product affinity is measured. For example: a category, a subcategory, or a brand. Values must have at least 100 purchases during the previous 30 days and at least 250 purchases during the previous 365 days to be included in product affinity model output. |
Ranking |
Integer |
A product attribute’s rank for this customer, where 1 equals the highest product affinity. |
Score |
Float |
The strength of a customers’s affinity for this product, shown as an uncalibrated probability between 0 and 1 that combines product-specific affinity with general likelihood to purchase. A higher score represents a stronger predicted affinity. Caution A customer score should only be used in relation to other customer scores for the same product attribute value. A customer score should not be used in absolute terms. A score does not directly correlate to ranking or audience sizes and should not be used in segments. Important Use audience size attributes or ranking when building segments for product affinity instead of customer scores. |
Export validation results
Export model results to Databricks, Google BigQuery, or Snowflake using an outbound bridge.
Configure an outbound bridge, and then select the predictive_tables dataset. The validation export includes per-product metrics such as total hit count, naive baseline performance, model performance at each audience size tier, along with hit rate and precision improvement percentages.