About recent activity
The recent activity panel appears on the right side of the Sources, Stitch, Customer 360, Queries, Segments, Campaigns, and Destinations pages and updates every time a workflow runs within your tenant.
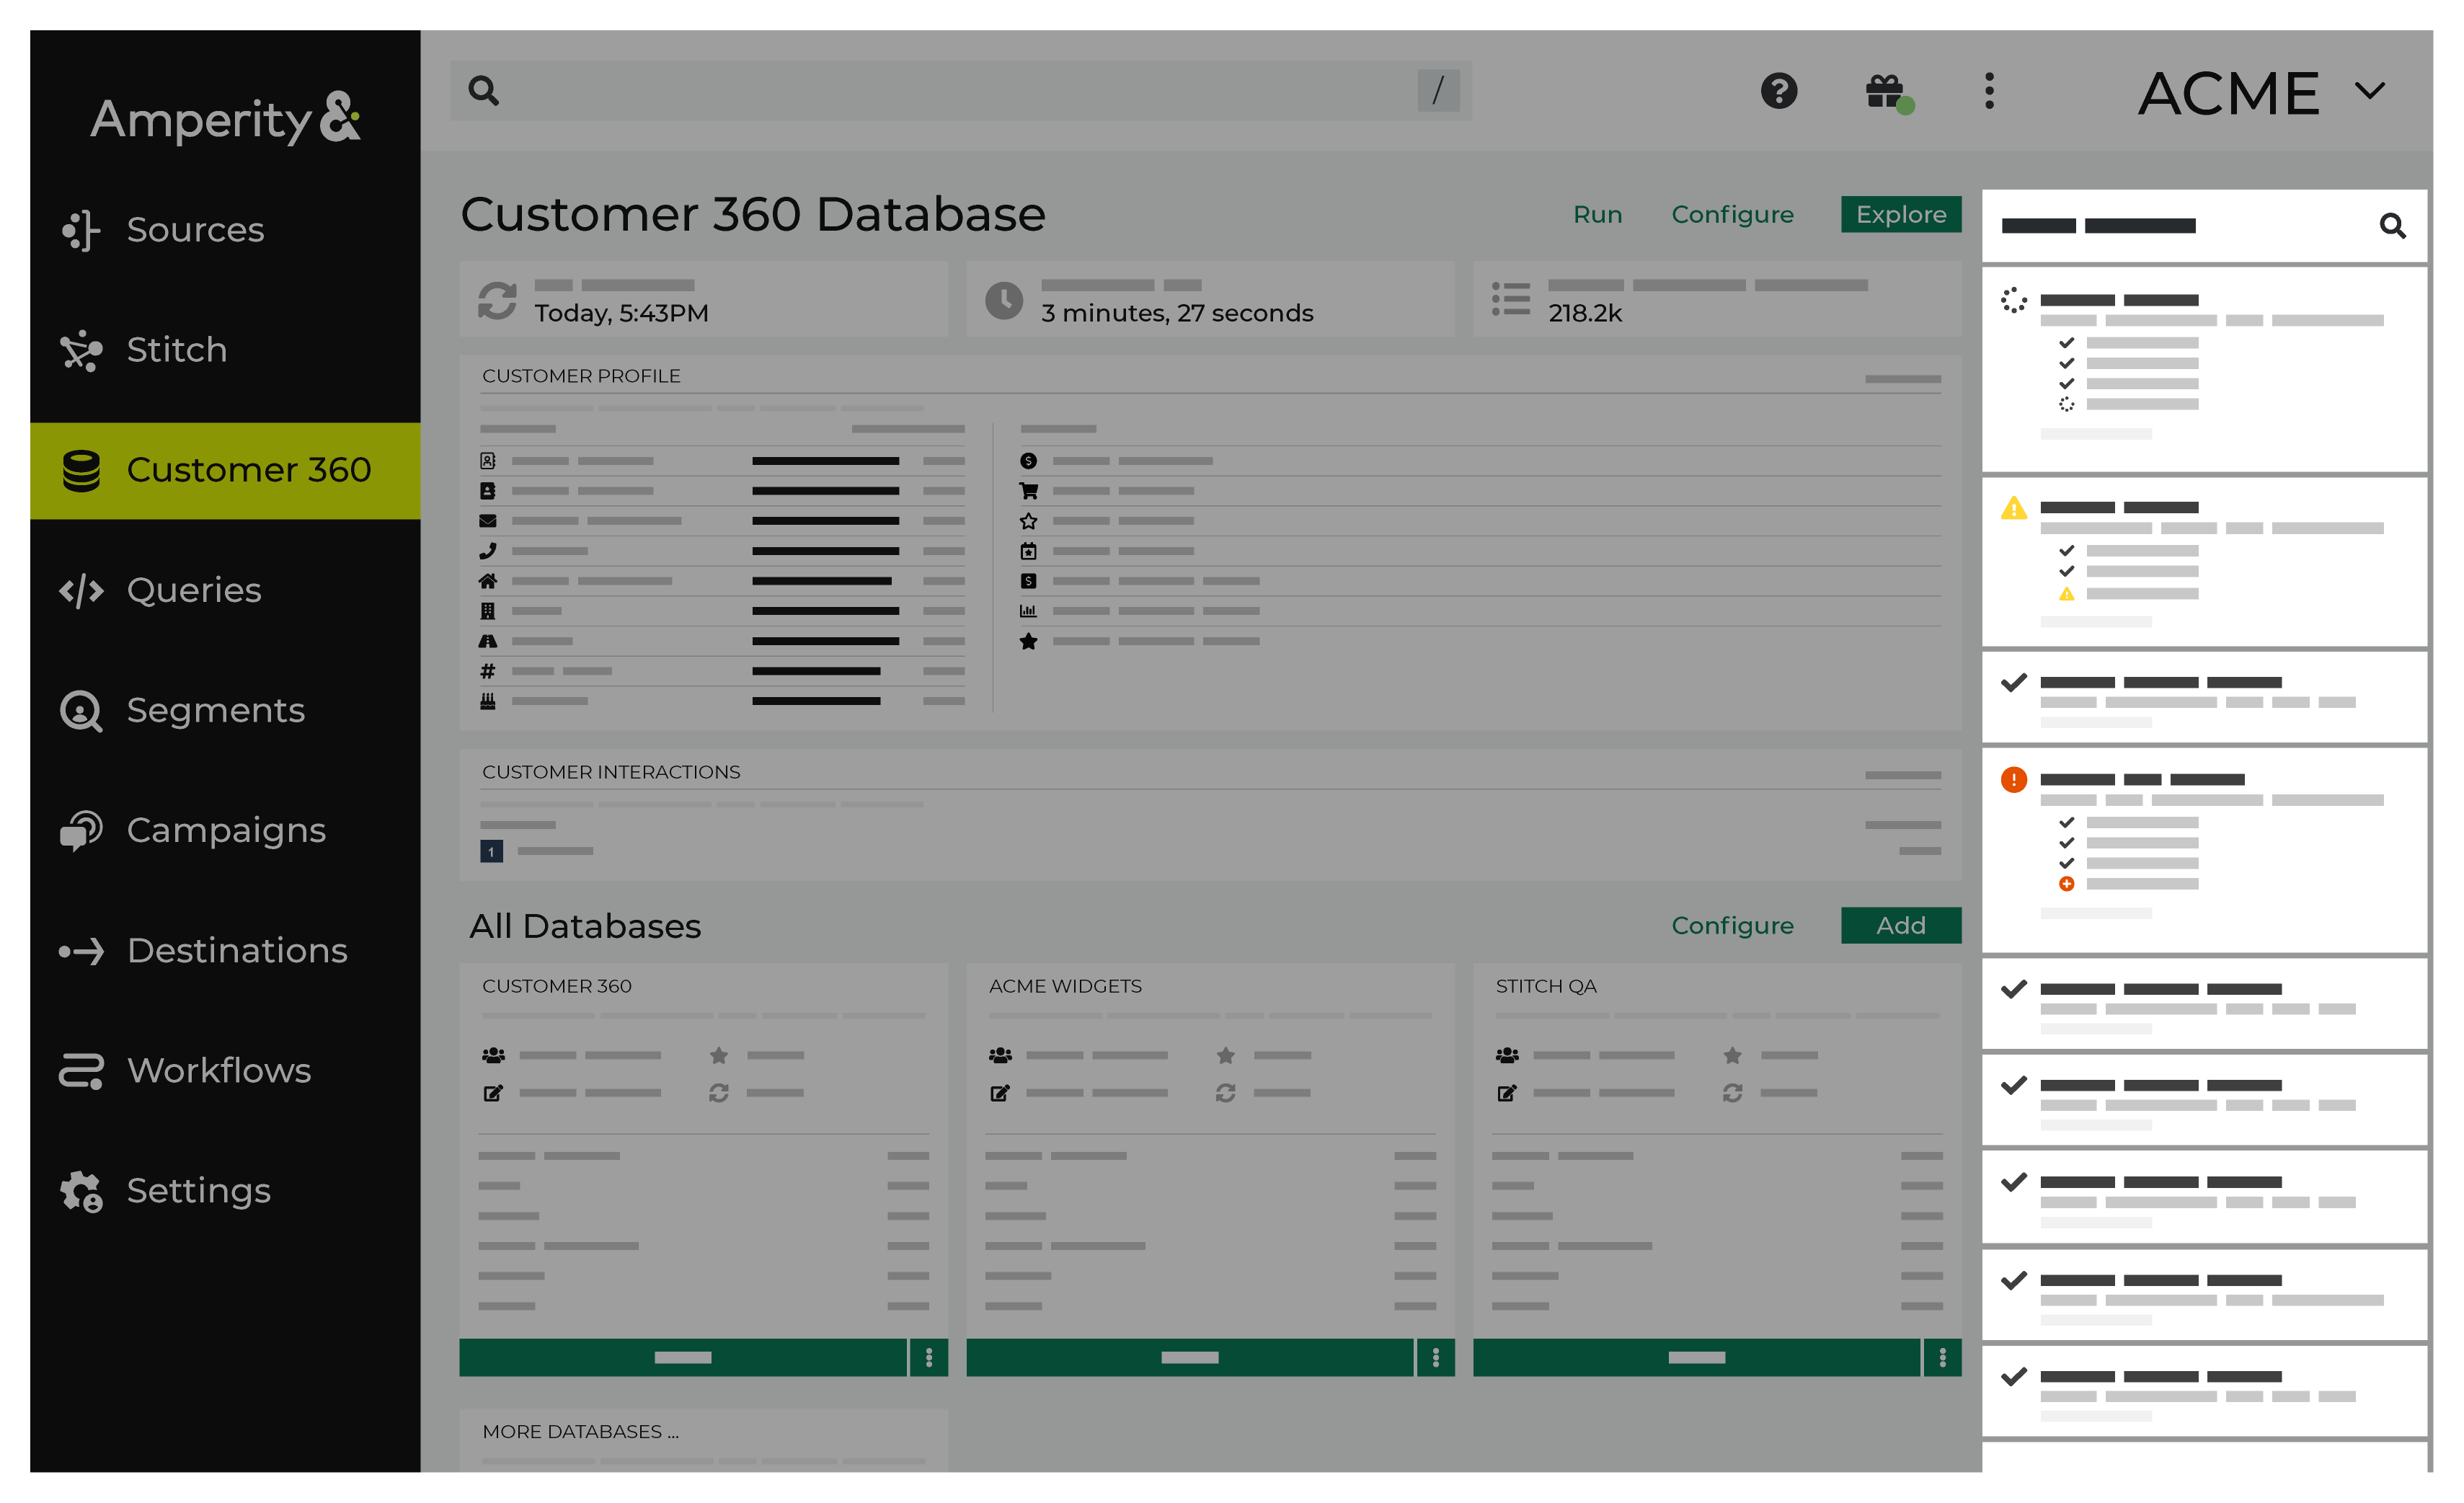
Use the recent activity pane to learn more about the state of workflows running in your tenant and as a starting point for resolving warnings and errors that may be shown for specific workflows.
Review the following sections:
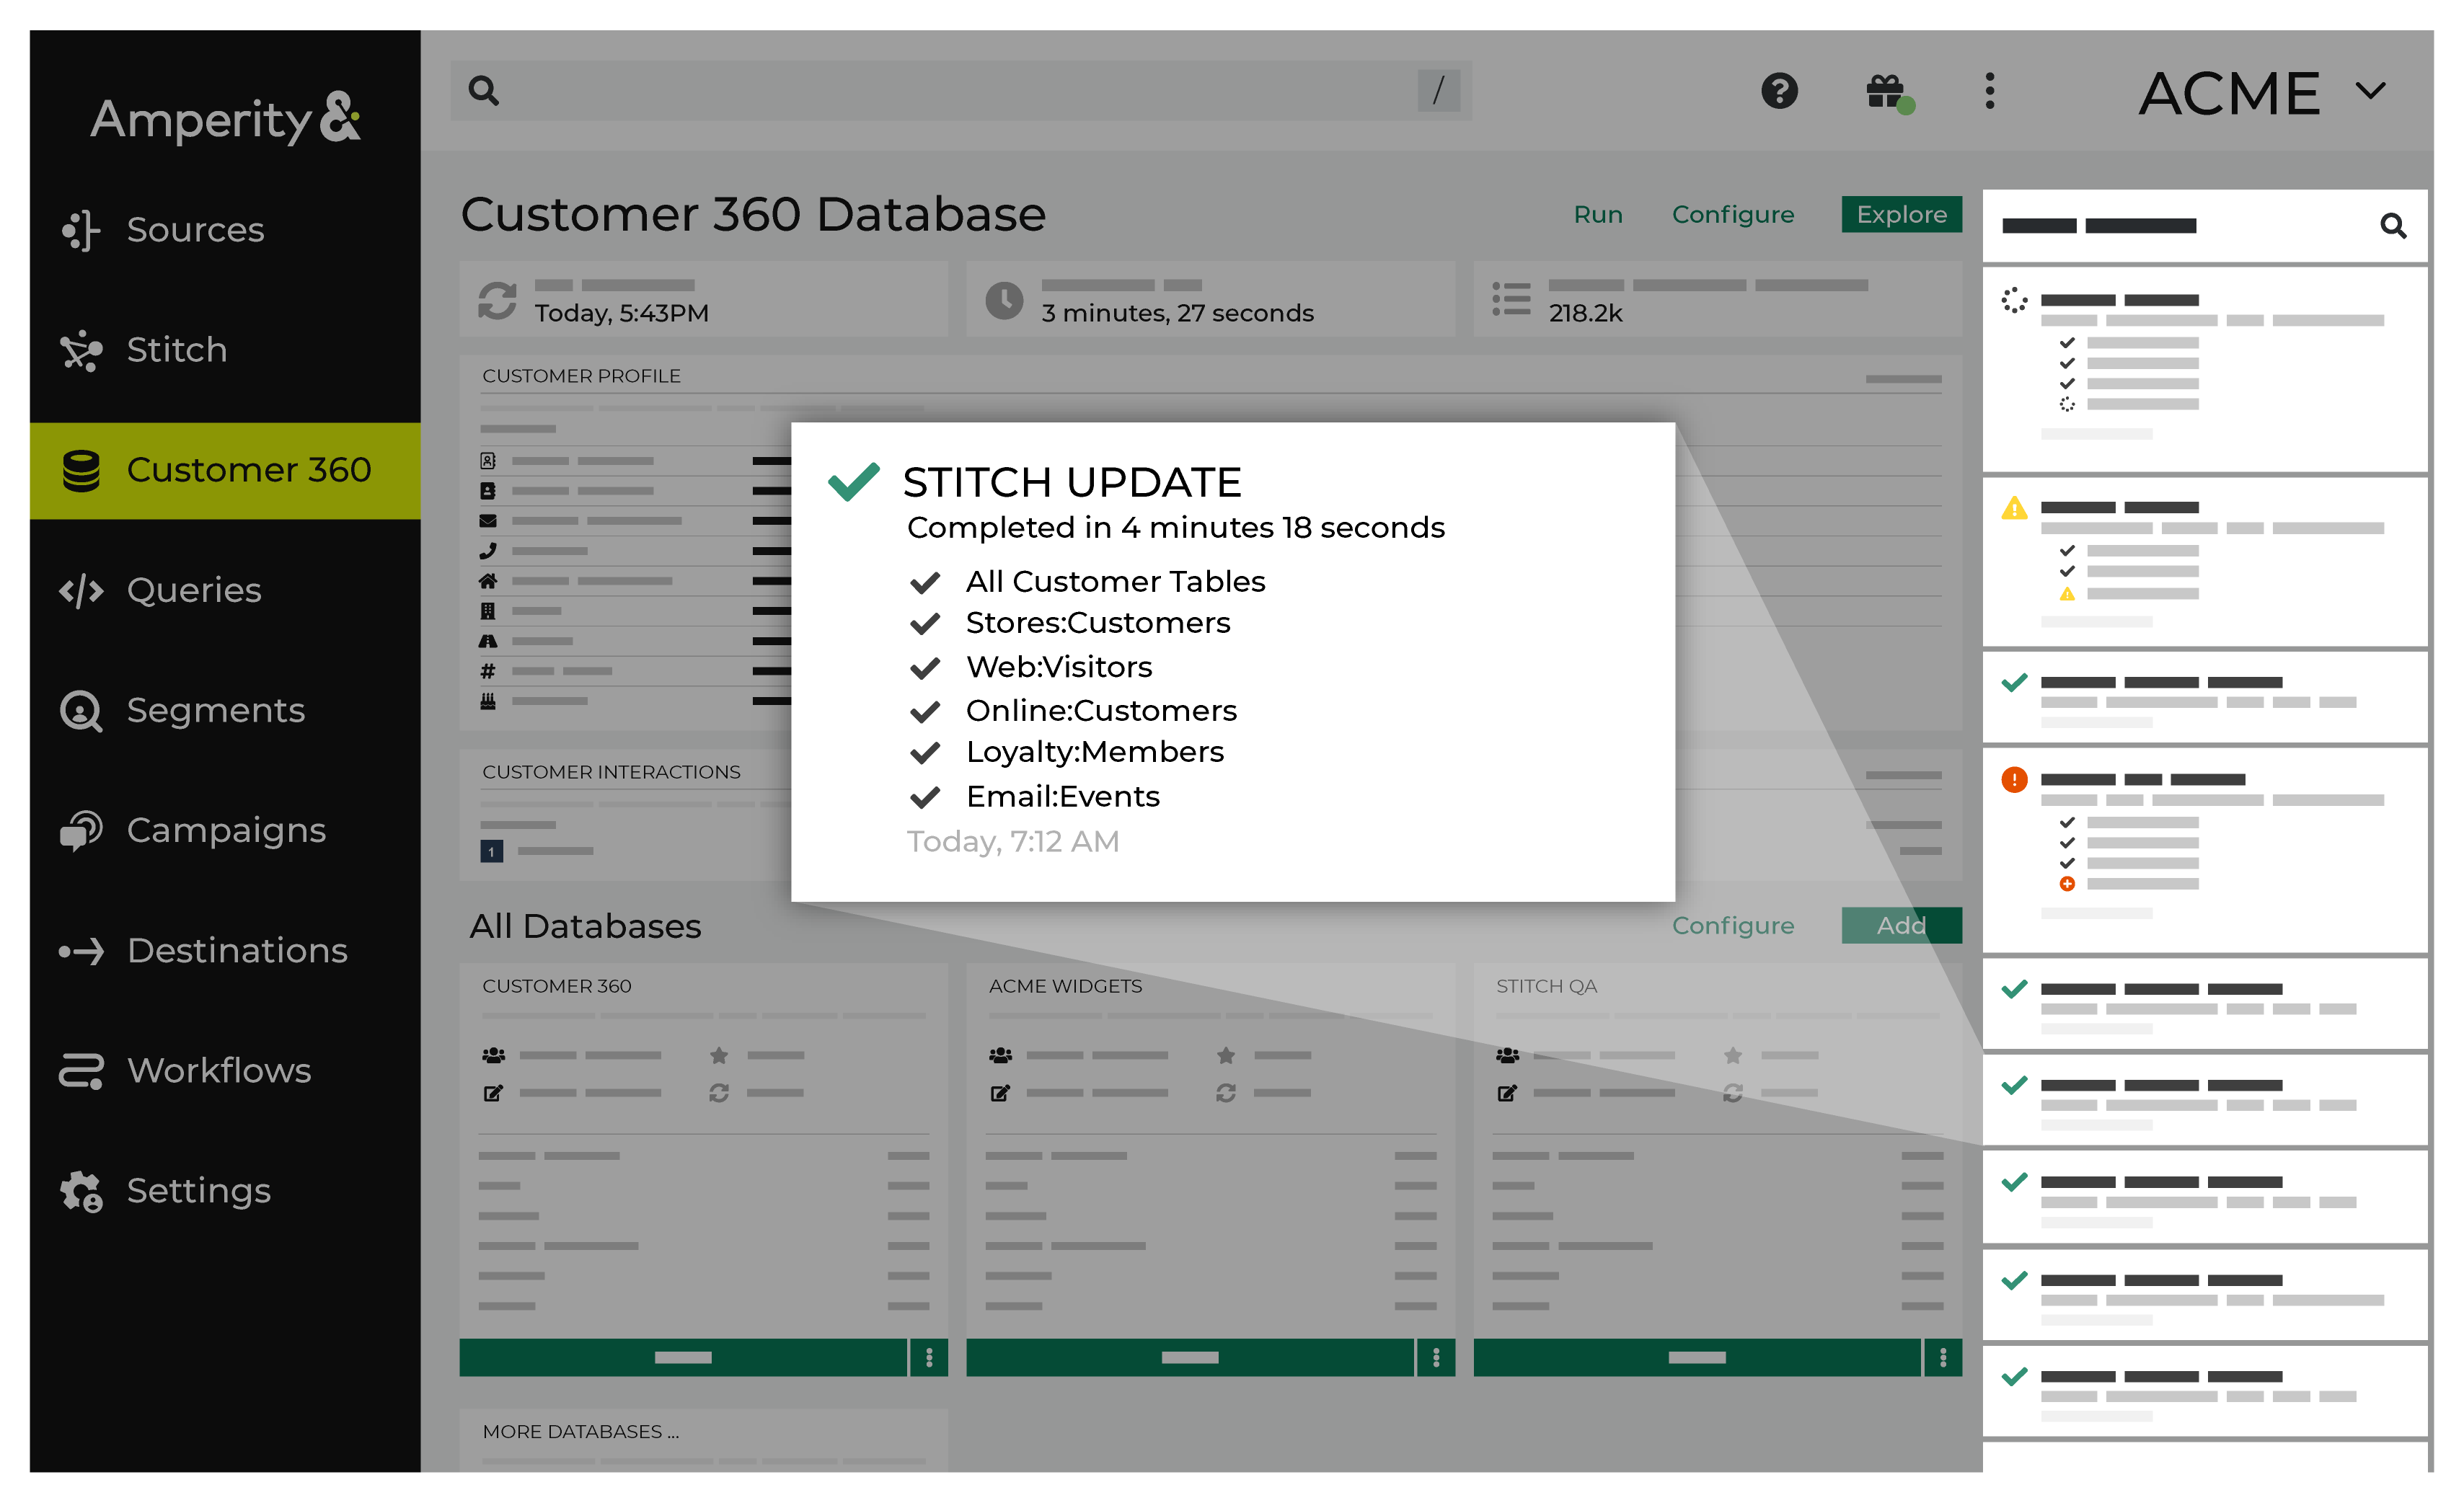
The first section describes notification types – Running, Completed, Warnings, and Error – and describes what you should expect from each notification type as they appear in the recent activity pane.
Fields are shown in notifications, such as links to validation reports and workflows, job, trace, IDs for use with troubleshooting, and status indicators, such as the amount of time a workflow ran.
The second section describes the notifications that appear within individual pages in the Amperity user interface. These sections are listed alphabetically by page: Campaign, Database, Orchestrations, Queries, Sources, Stitch reports, and Stitch runs.
A list of how-tos that are available to workflows, including resolving workflow errors.
Notification types
All notifications within the recent activity pane fall into one of the following general types:
Important
Notifications fall into general behaviors, but all notifications within your tenant are specific to your tenant and reflect how your tenant is configured. The names of data sources, feeds, couriers, tables, databases, queries, orchestrations, destinations, and campaigns appears in the notifications.
If there is an error, such as a processing error related to a specific column within a custom table, the notification contains the names you chose for the custom table and also for the columns within that table.
If you are unable to resolve a warning or an error using workflow actions, please contact Amperity support.
Running
A running notification – indicated by the icon – is shown when a workflow is running, but has not finished every step in the workflow.
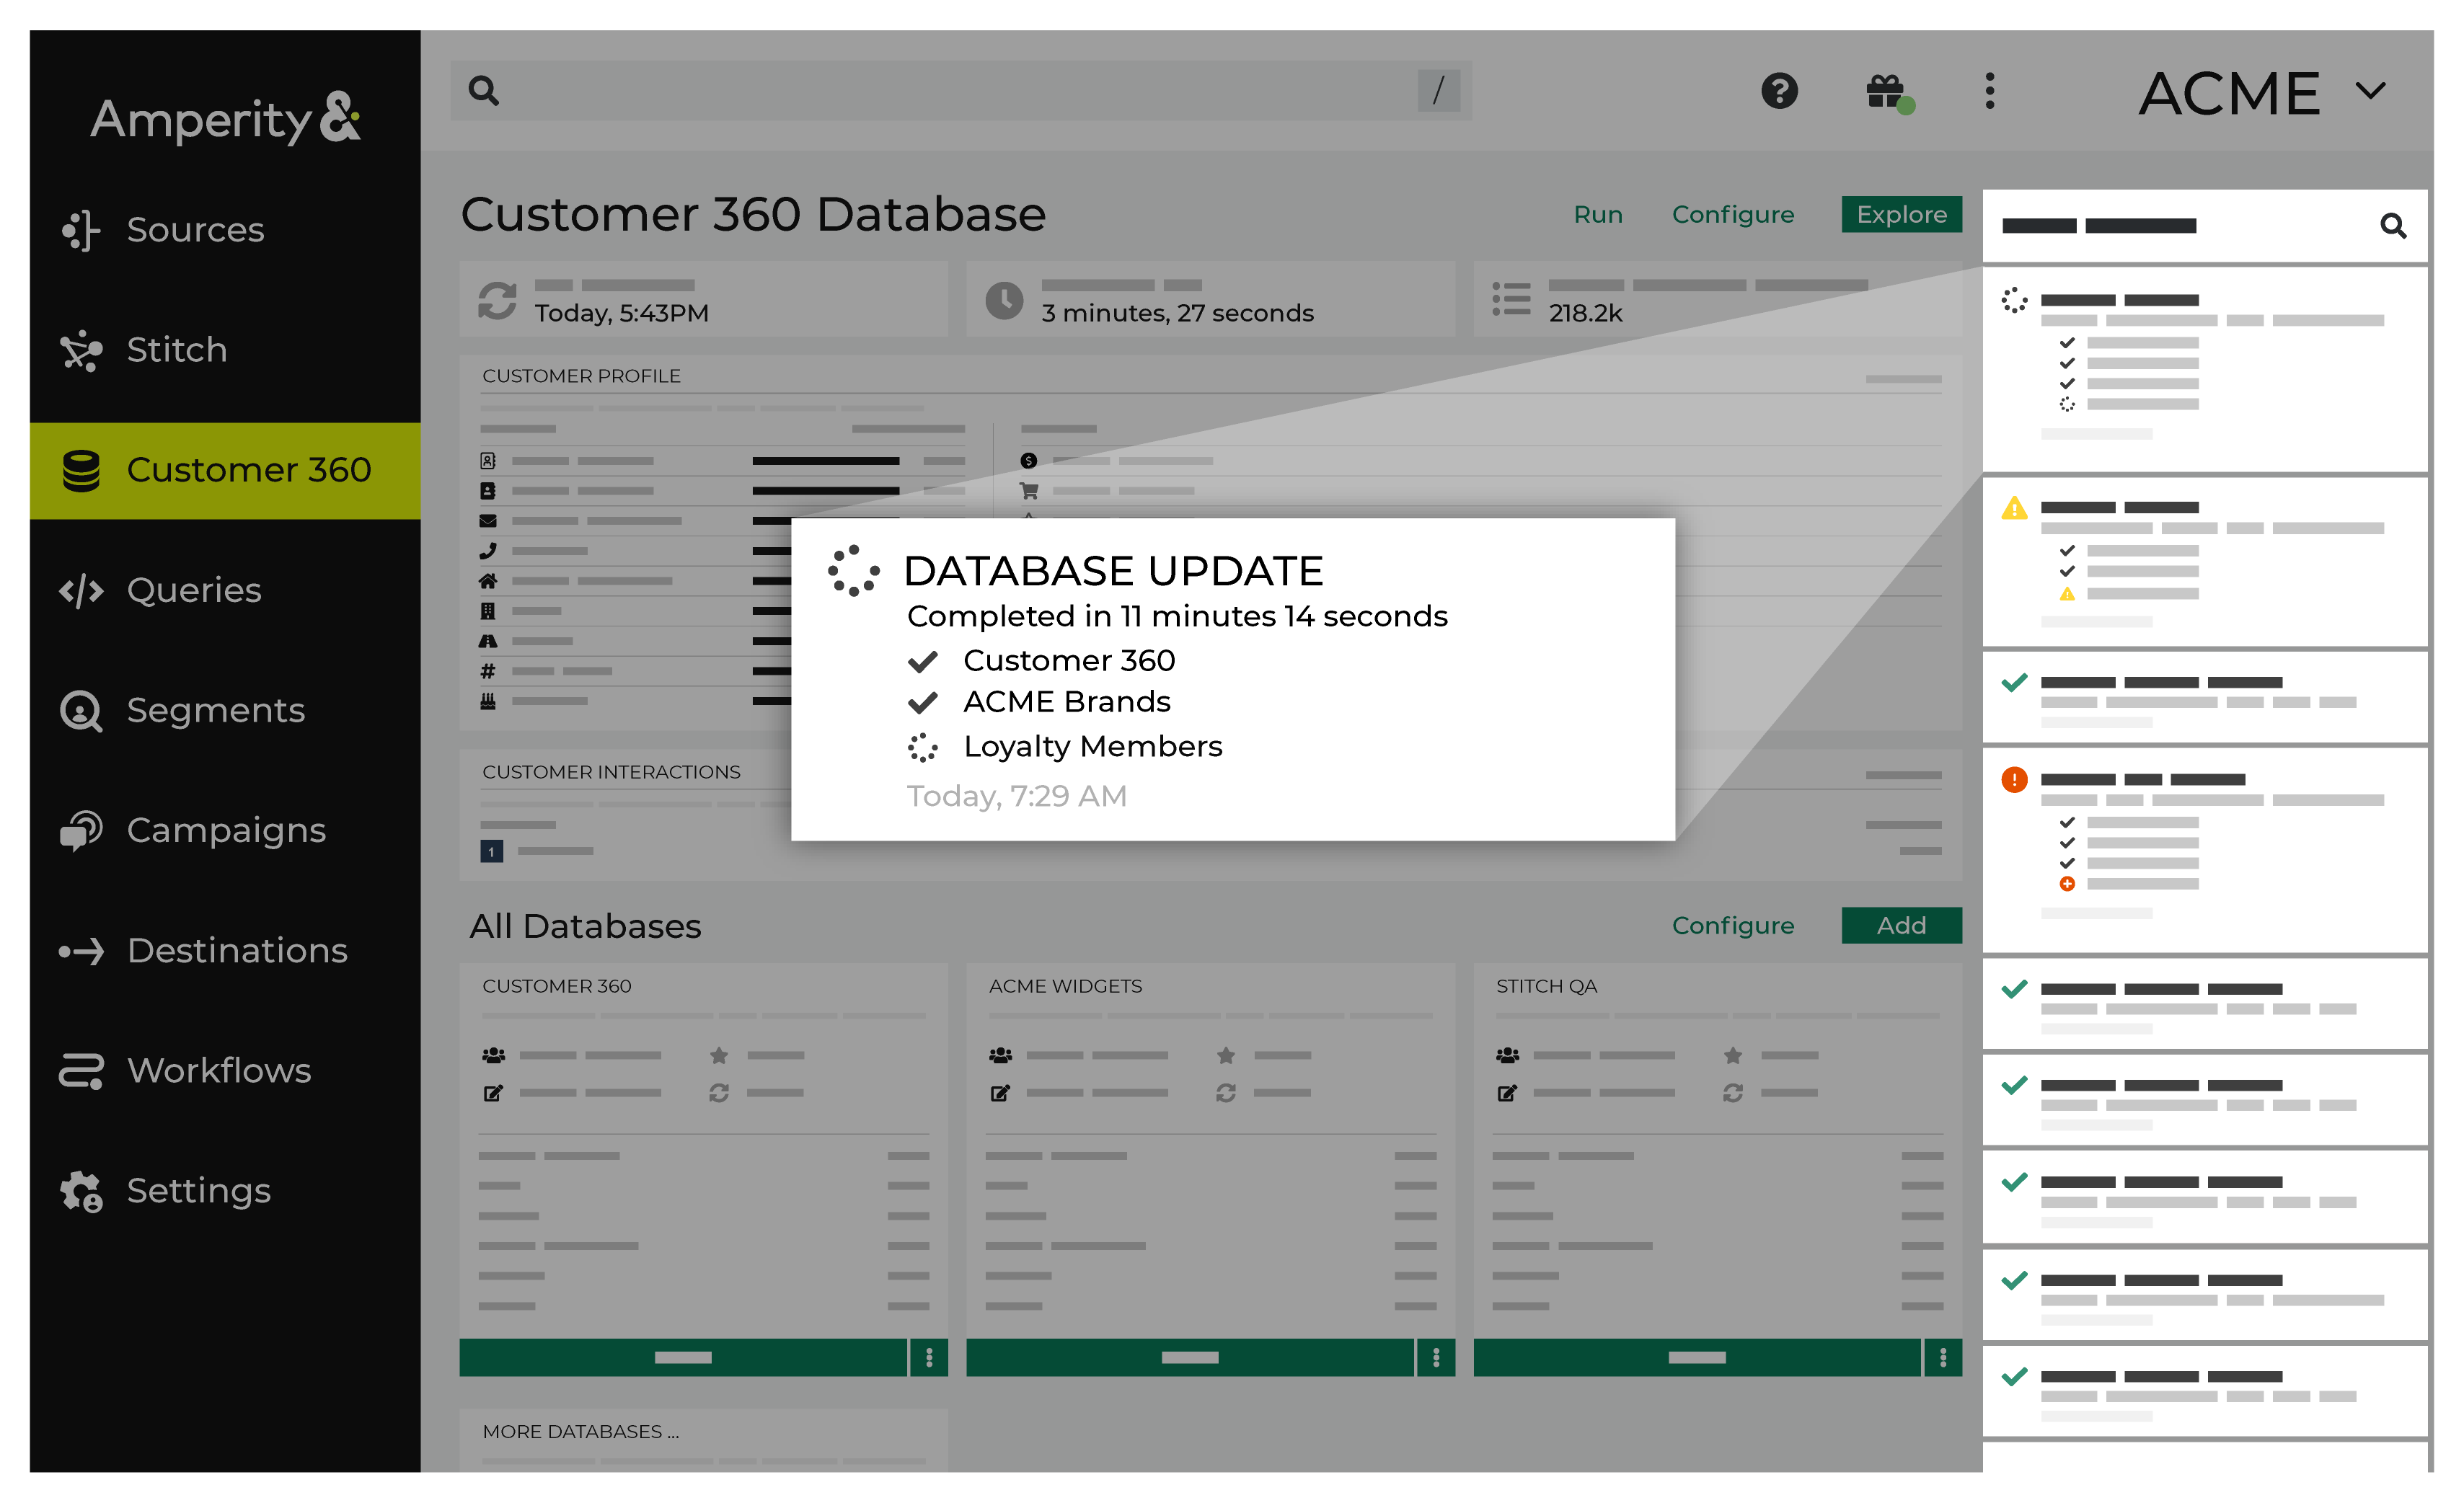
For example, a notification for a workflow that is running is updated with details for each step in that workflow as it completes. You can open the Workflows page and view details for each step that is taken by that workflow as they are taken.
Completed
A completed notification–indicated by the icon–is shown when the workflow has finished running and all steps in that workflow were successful. This is the most common type of notification that you will see in the notification pane in your daily production tenant.
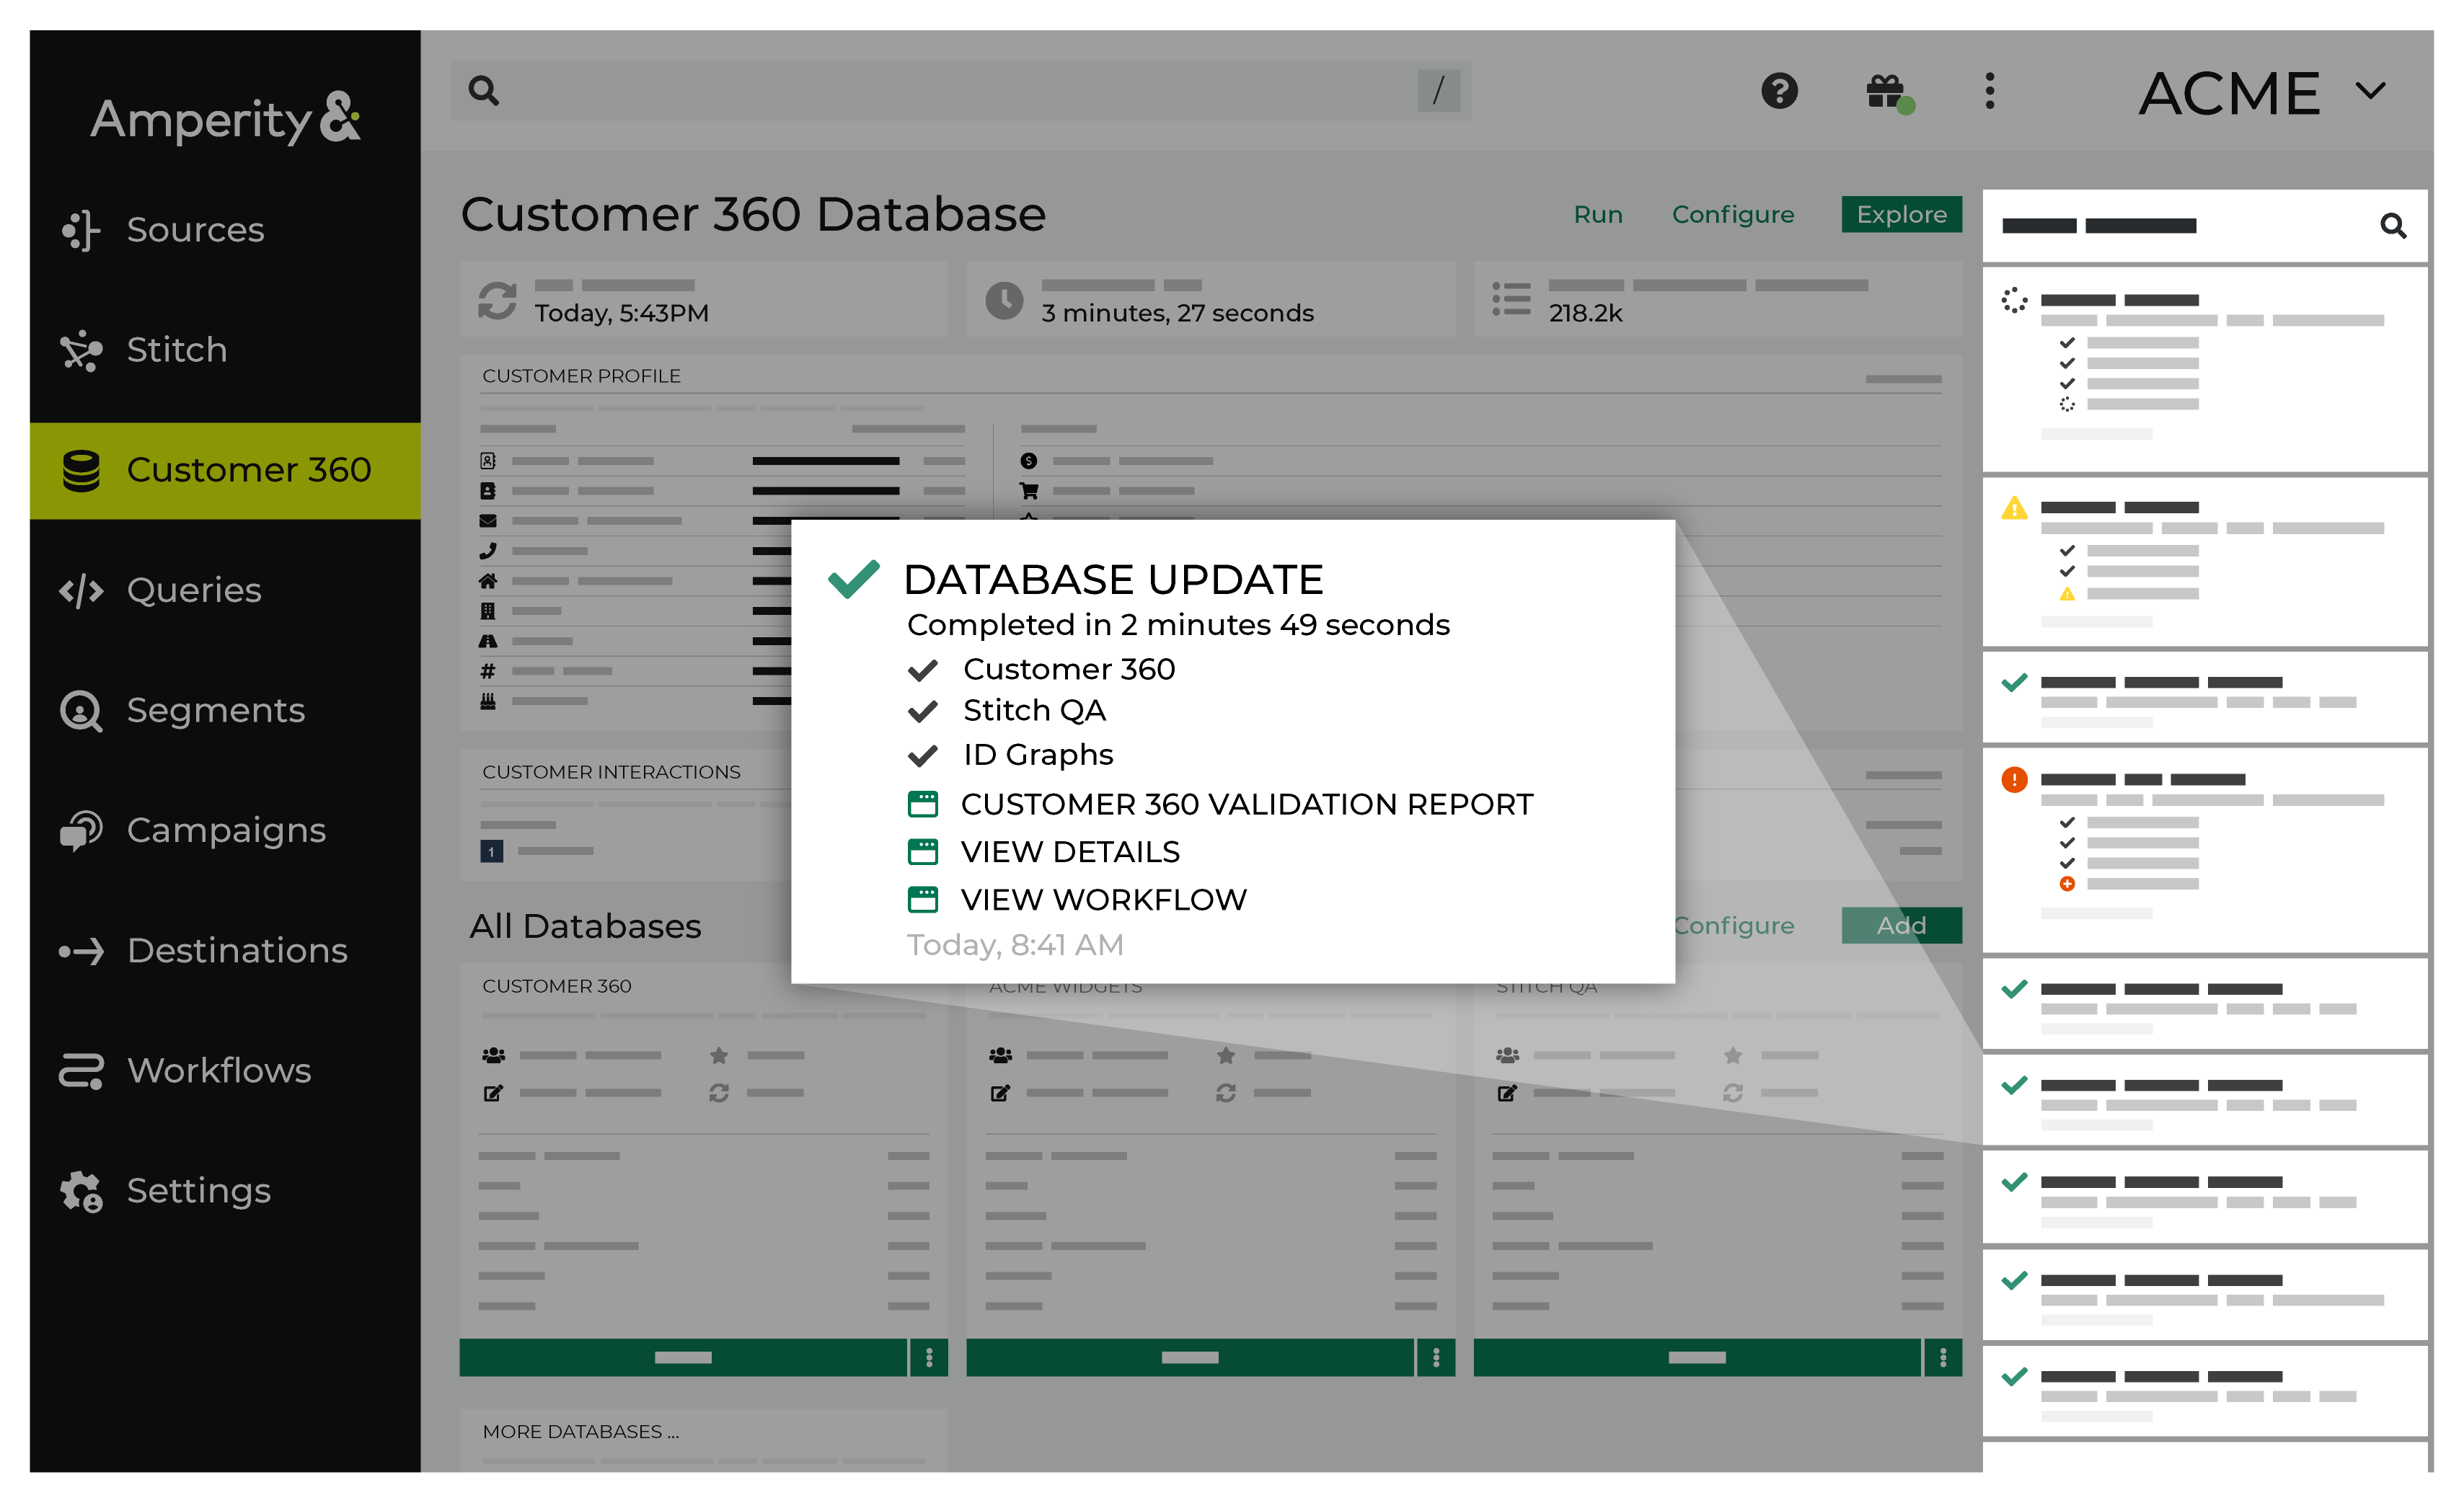
For example, a notification for a workflow that has completed successfully contains links to:
A Validation Report
A View Details modal that shows how long it took for each table to be updated
A page for the workflow in the Workflows page, from which you can review details for each step in the workflow
Warnings
A warning notification–indicated by the icon–is shown when a workflow is able to complete all steps, but detects issues with one or more steps within the workflow.
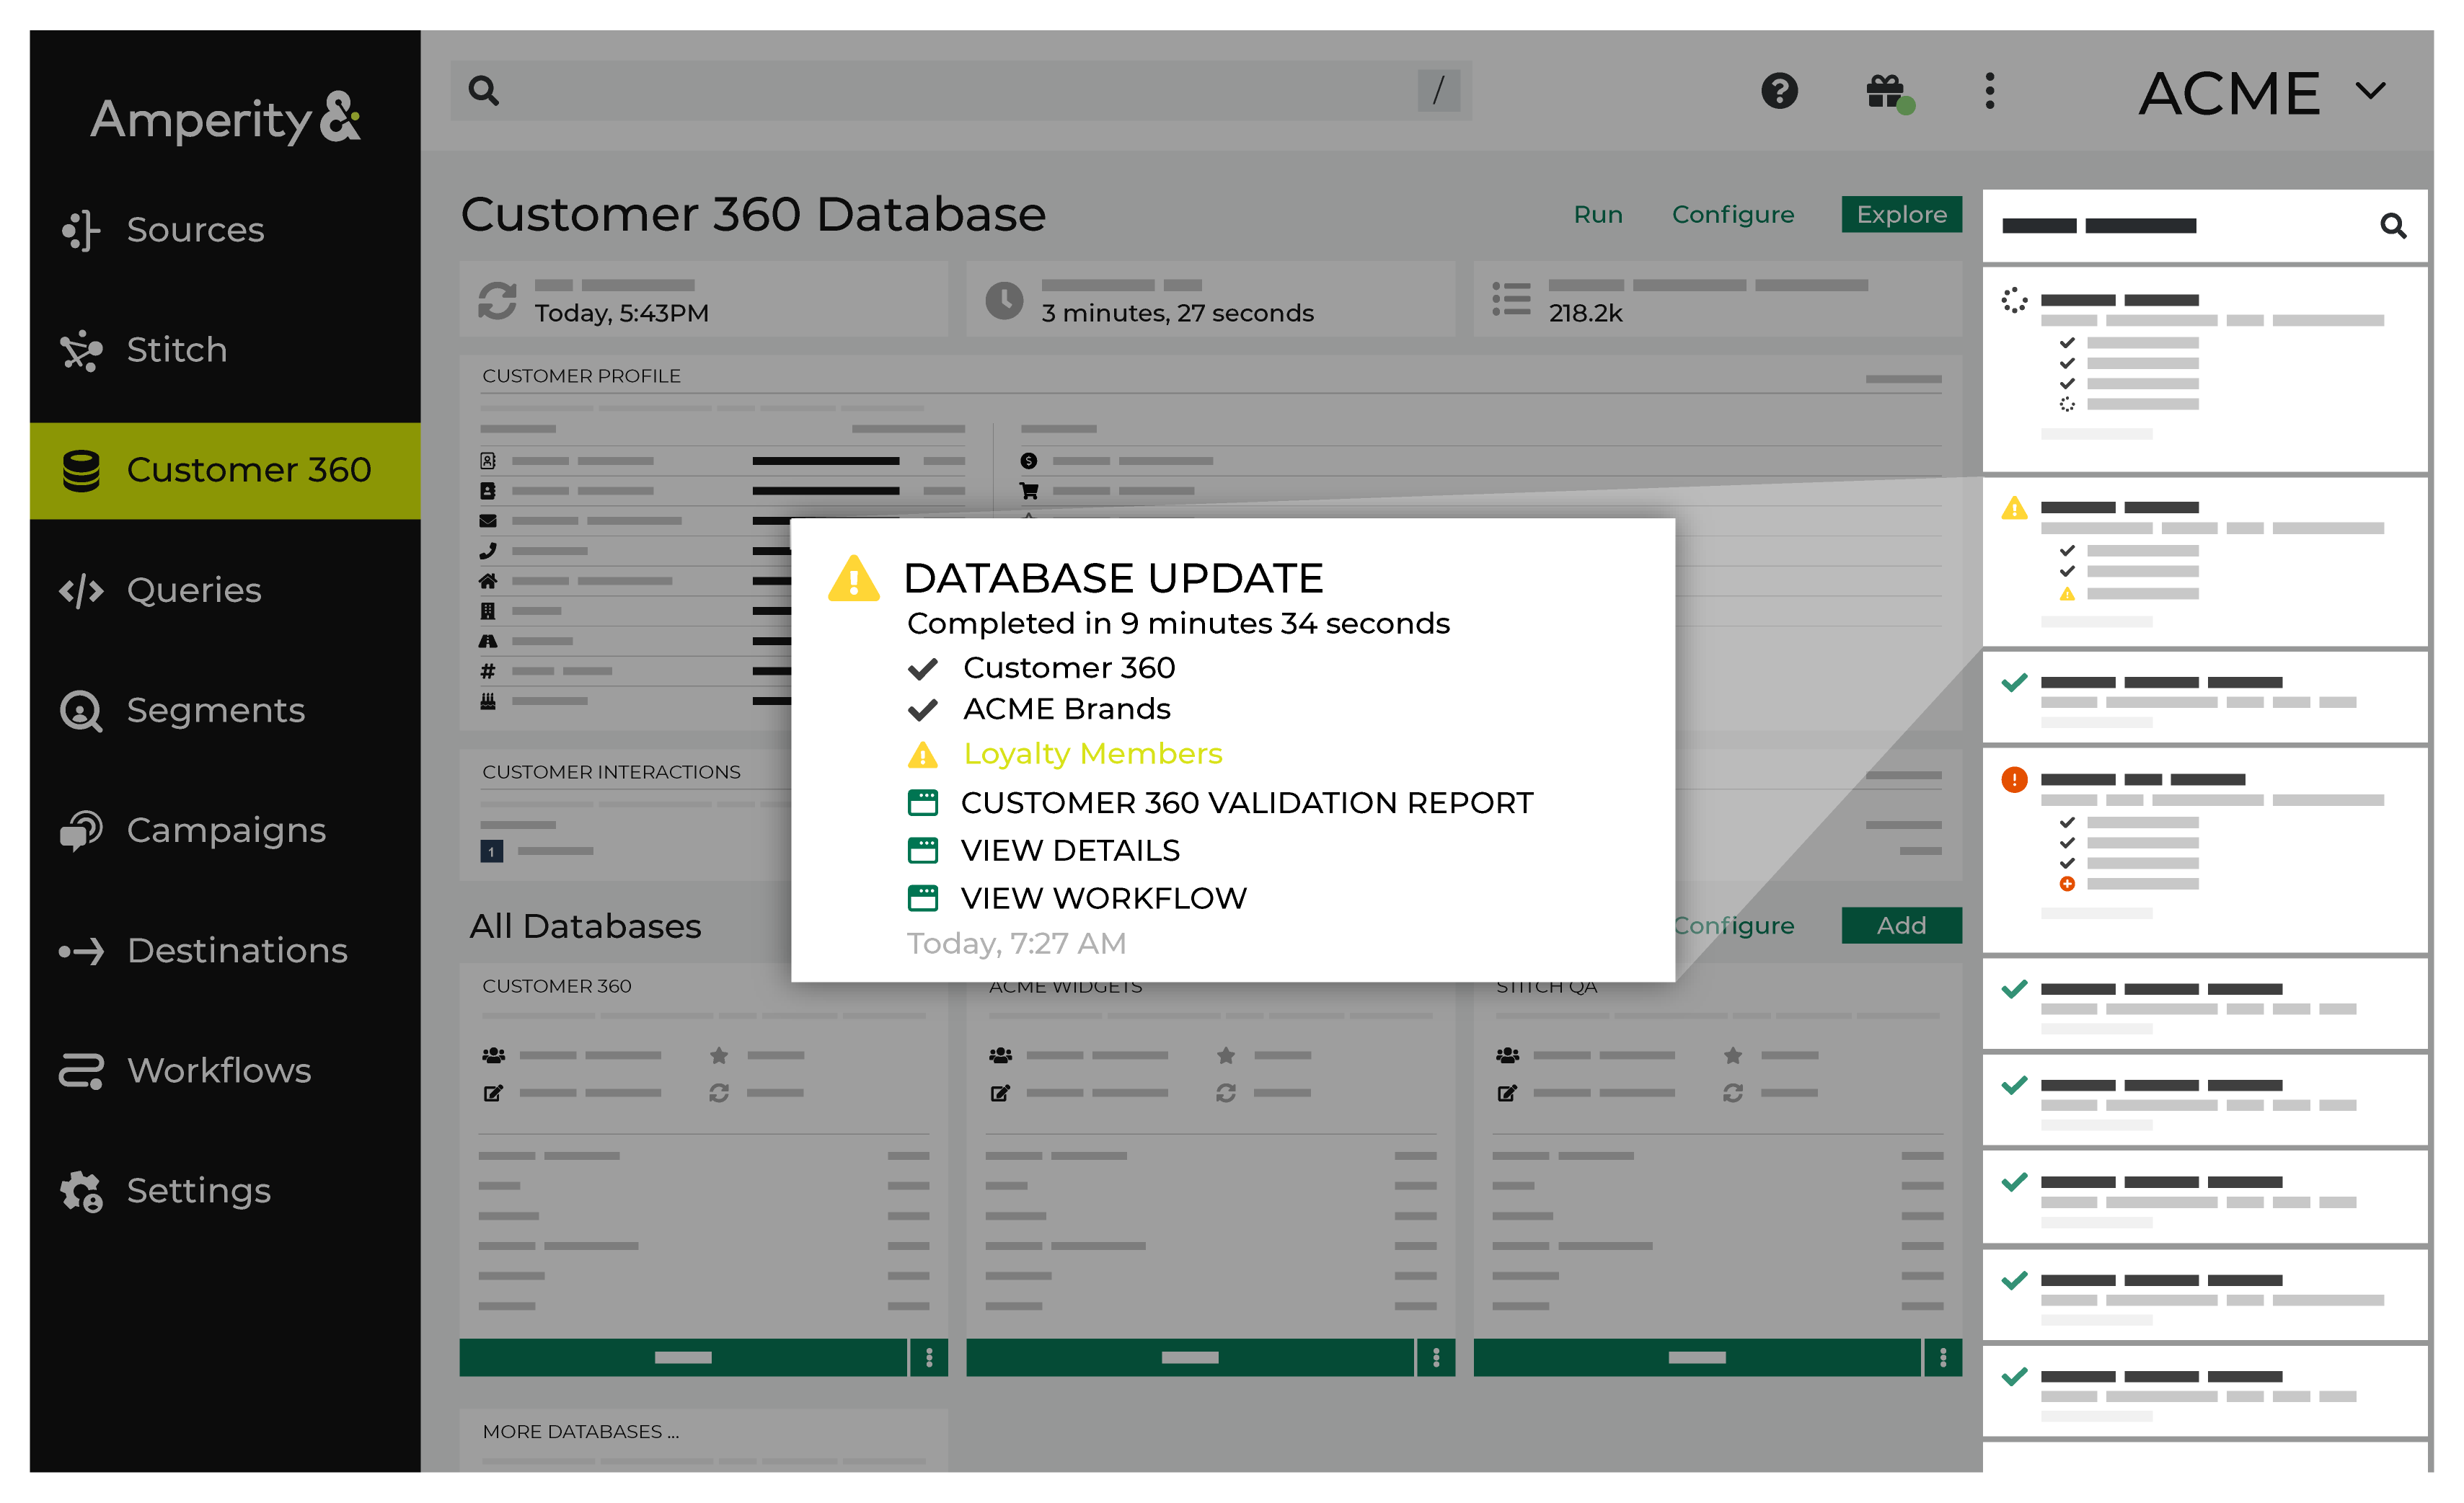
For example, a notification for a workflow that has detected an issue shows the warning icon along with a message that describes the issue, such as:
Unique validation failed for database "Customer 360" table
"Unified_Transactions" column "order_id"
and then contains links to:
A Validation Report
A View Details modal that shows how long it took for each table to be updated
A page for the workflow in the Workflows page, from which you can review details for each step in the workflow
Important
Each warning is specific to a step in the workflow. In many cases a warning will not prevent the completion of your daily workflow, but it does indicate that a step in your workflow requires attention and that you should work to resolve what caused it as soon as possible.
Errors
An error notification–indicated by the icon–is shown when a workflow is unable to complete all steps.
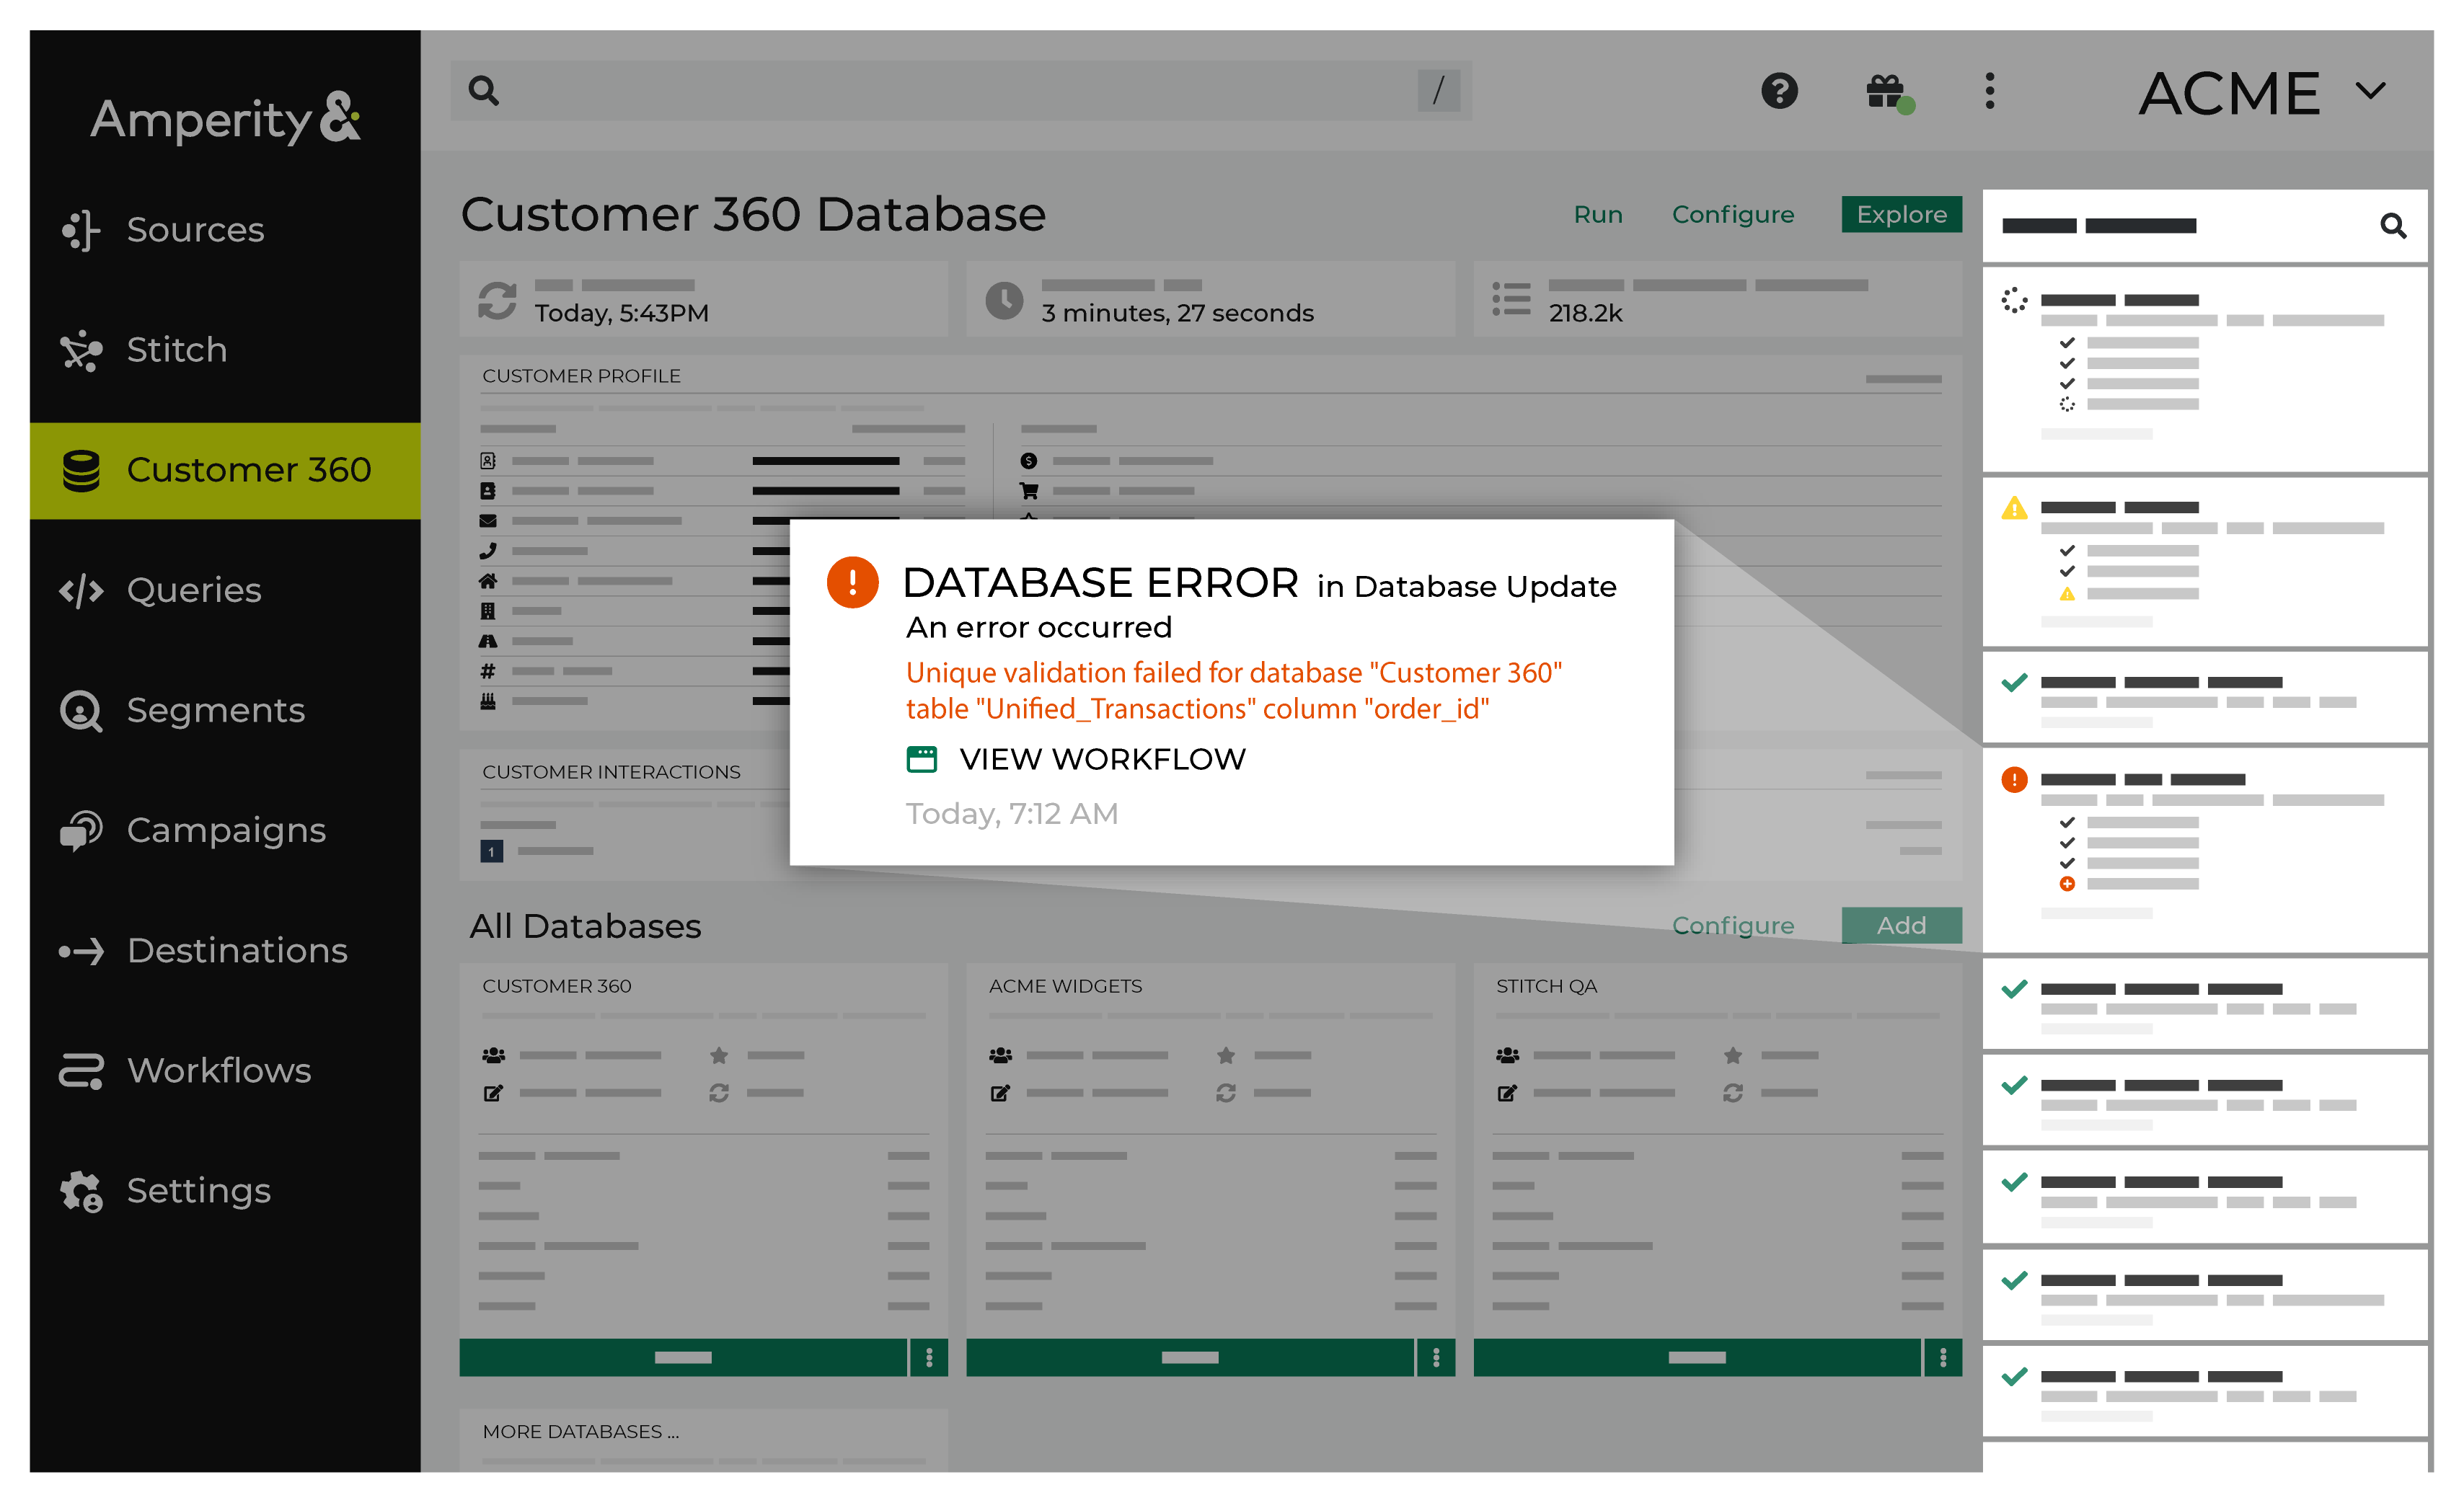
For example, a notification for a workflow that contains an error shows the error icon and the workflow stops.
A message is shown that describes the error, such as:
Error analyzing table "Unified_Transactions" in database "C360":
cannot resolve '`loyalty_tier`' given input columns:
[Unified_Customer.address, Unified_Customer.address2, ... ]
Caution
Each error is specific to a step in that workflow. In all cases an error prevents the completion of that workflow. You should open the Workflows page, review the error in the workflow, and then work to resolve the error immediately.
Each workflow error will present a list of suggested workflow actions that are specific to this workflow error:
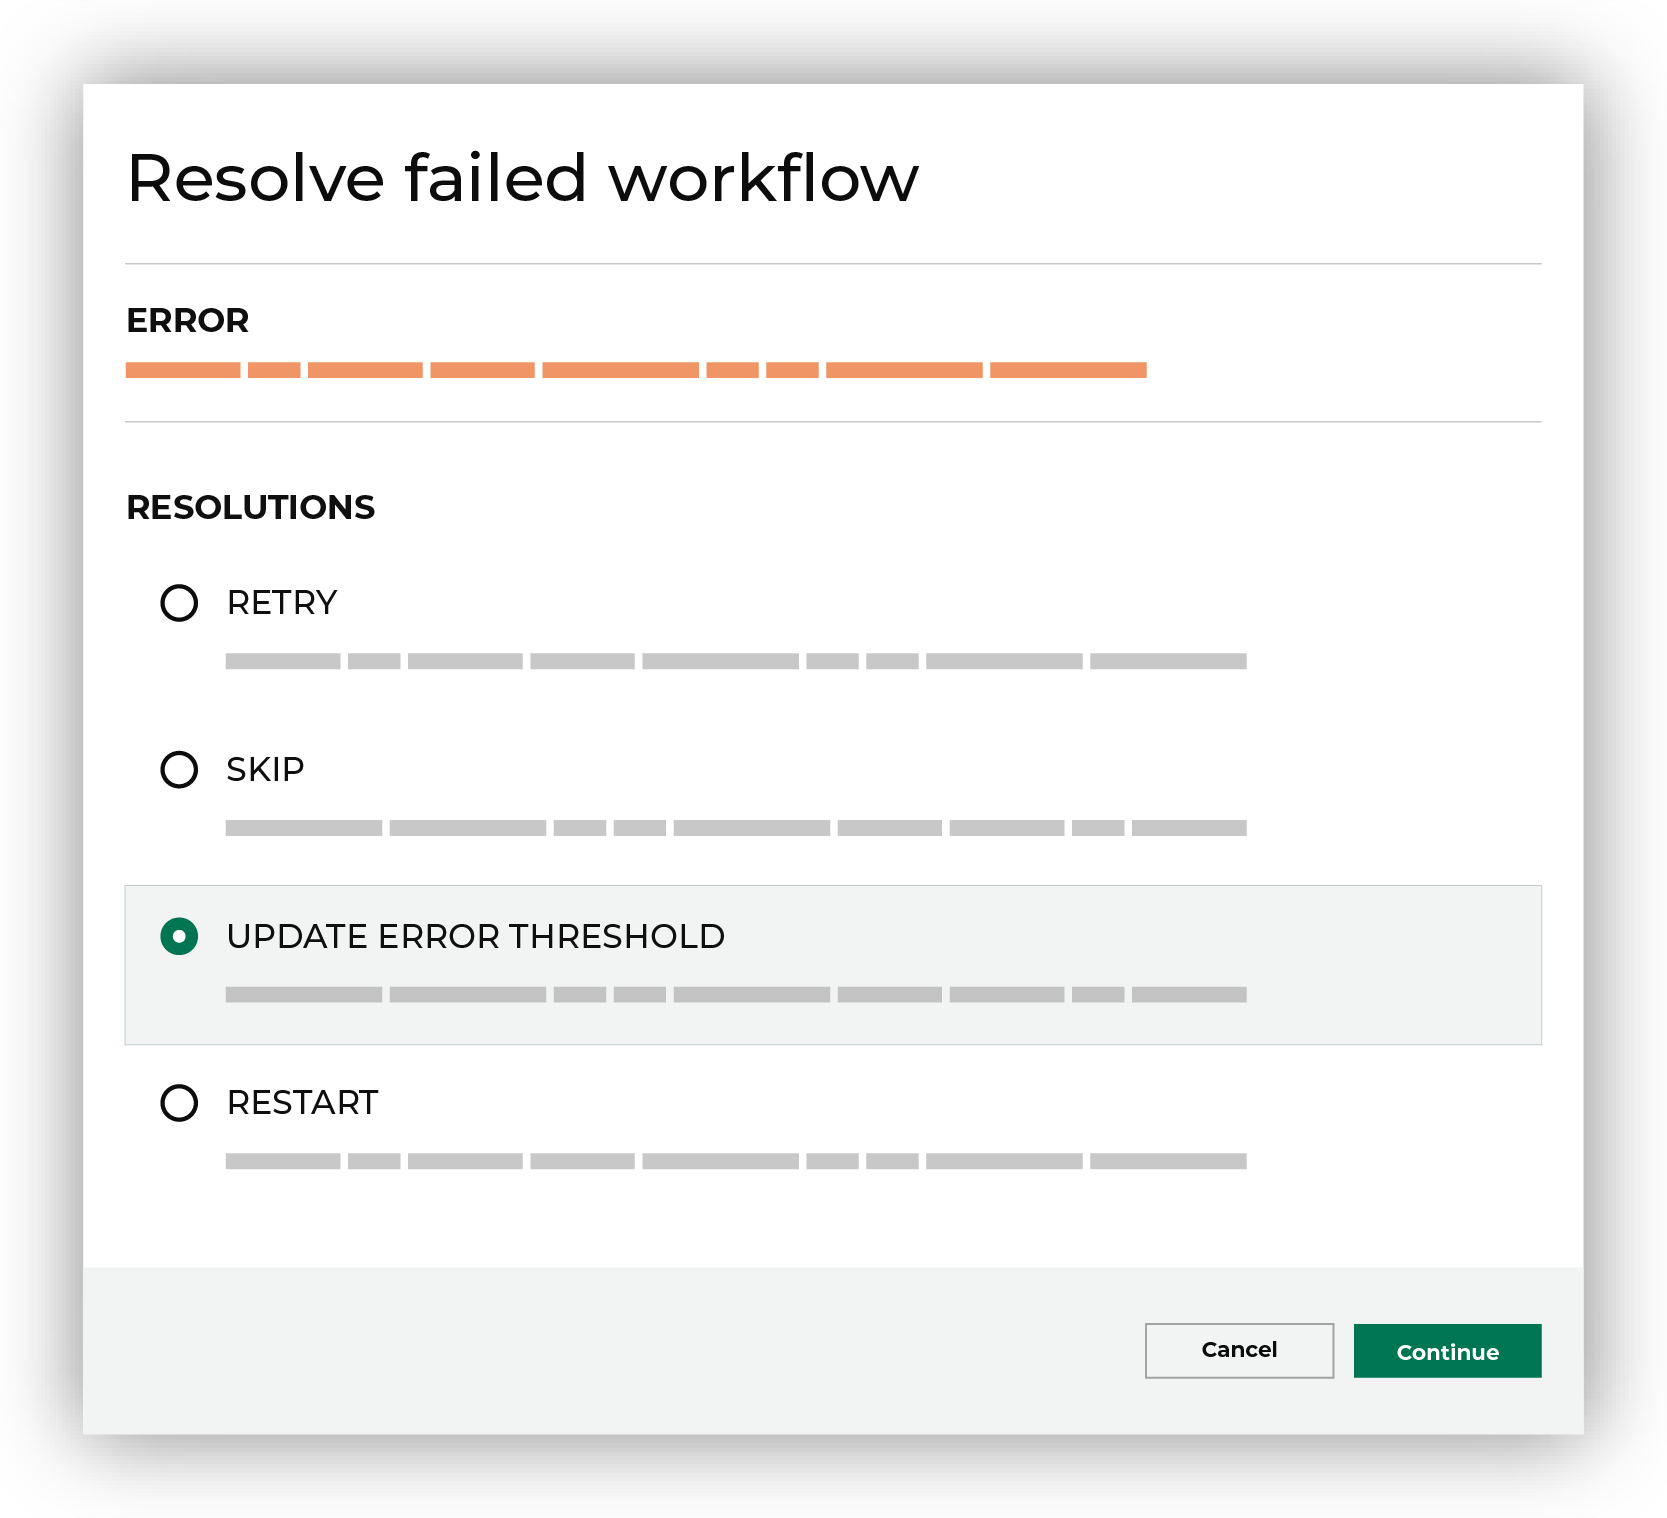
Select the radio button for the workflow action that you determine to be the best way to resolve this error, after which the workflow will perform that action.
Tip
If you are unable to resolve an error, please contact your Amperity representative.
Download ingest error logs
When a file shows an error on ingest you can troubleshoot those errors by downloading CSV files that contain error logs from the Ingest Details page.
The Ingest Details page is accessible from the Recent activity pane in the Sources page. Error logs are only available for download when errors are present.
Error log files have the following types:
A feed-level log file that describes the types and frequency of errors.
From the Ingest Details page, open the actions menu– –for the feed, and then click Download feed error log.
A file-level log that describes each error.
From the Ingest Details page, expand the table row to show the file, open the actions menu– –for the file, and then click Download file error log.
Notification fields
Field |
Area |
Description |
|---|---|---|
Completion time |
Databases, Orchestrations, Sources, Stitch |
The duration of time for a job to complete. |
Databases |
Databases, Queries |
The databases processed during the databases update process. |
Ingest details |
Databases, Queries, Sources |
These details include information on file IDs, file names, records read, errors, records ingested, load start and end times, duration, and an error log. |
Job ID |
Campaigns, Orchestrations, Queries, Sources, |
A unique string containing letters, numbers and special characters associated with the job. |
Queries |
Databases, Sources, |
The number of queries processed. |
Spark job |
Databases, Sources, Stitch |
Is a job that processes Spark SQL queries related to the Stitch process and to building databases. |
Stitch metrics |
Stitch |
These metrics display the tenant, the time at which the job started, the ID for the Stitch report, the Stitch ID, the collapsed ID count, related pairs count, and filtered related pair count. |
Stitch report |
Stitch |
A Stitch report displays cluster graphs for individuals associated with the Amperity ID. |
Tables |
Databases, Orchestrations, Sources, Stitch |
The tables that are processed in orchestration process. |
Title |
Databases, Orchestrations, Queries, Sources, Stitch |
The title of the notification. |
Trace ID |
Databases, Orchestrations, Queries, Stitch |
A unique string containing letters, numbers and special characters associated with a trace. |
Updates |
Databases, Orchestrations, Sources, Stitch |
These updates include details on the databases build, database gen batch, and database publish processes. |
Validation report |
Databases |
This report validates data pulled from tables and may return records with errors associated with them. |
View Campaign |
Databases |
View details for a campaigns. |
View Workflows |
Databases, Orchestrations, Sources |
View workflow details for the campaigns, courier groups, couriers, data ingest, database refresh, orchestration groups, and orchestration tasks by clicking the View Workflow link. |
Campaigns
Notifications for the Campaigns page appear after Amperity processes the segments, and then sends the results to the configured destinations. Notifications typically indicate successful outcomes. Less often, notifications contain details for non-successful outcomes, such as failures related to upstream or downstream processes.
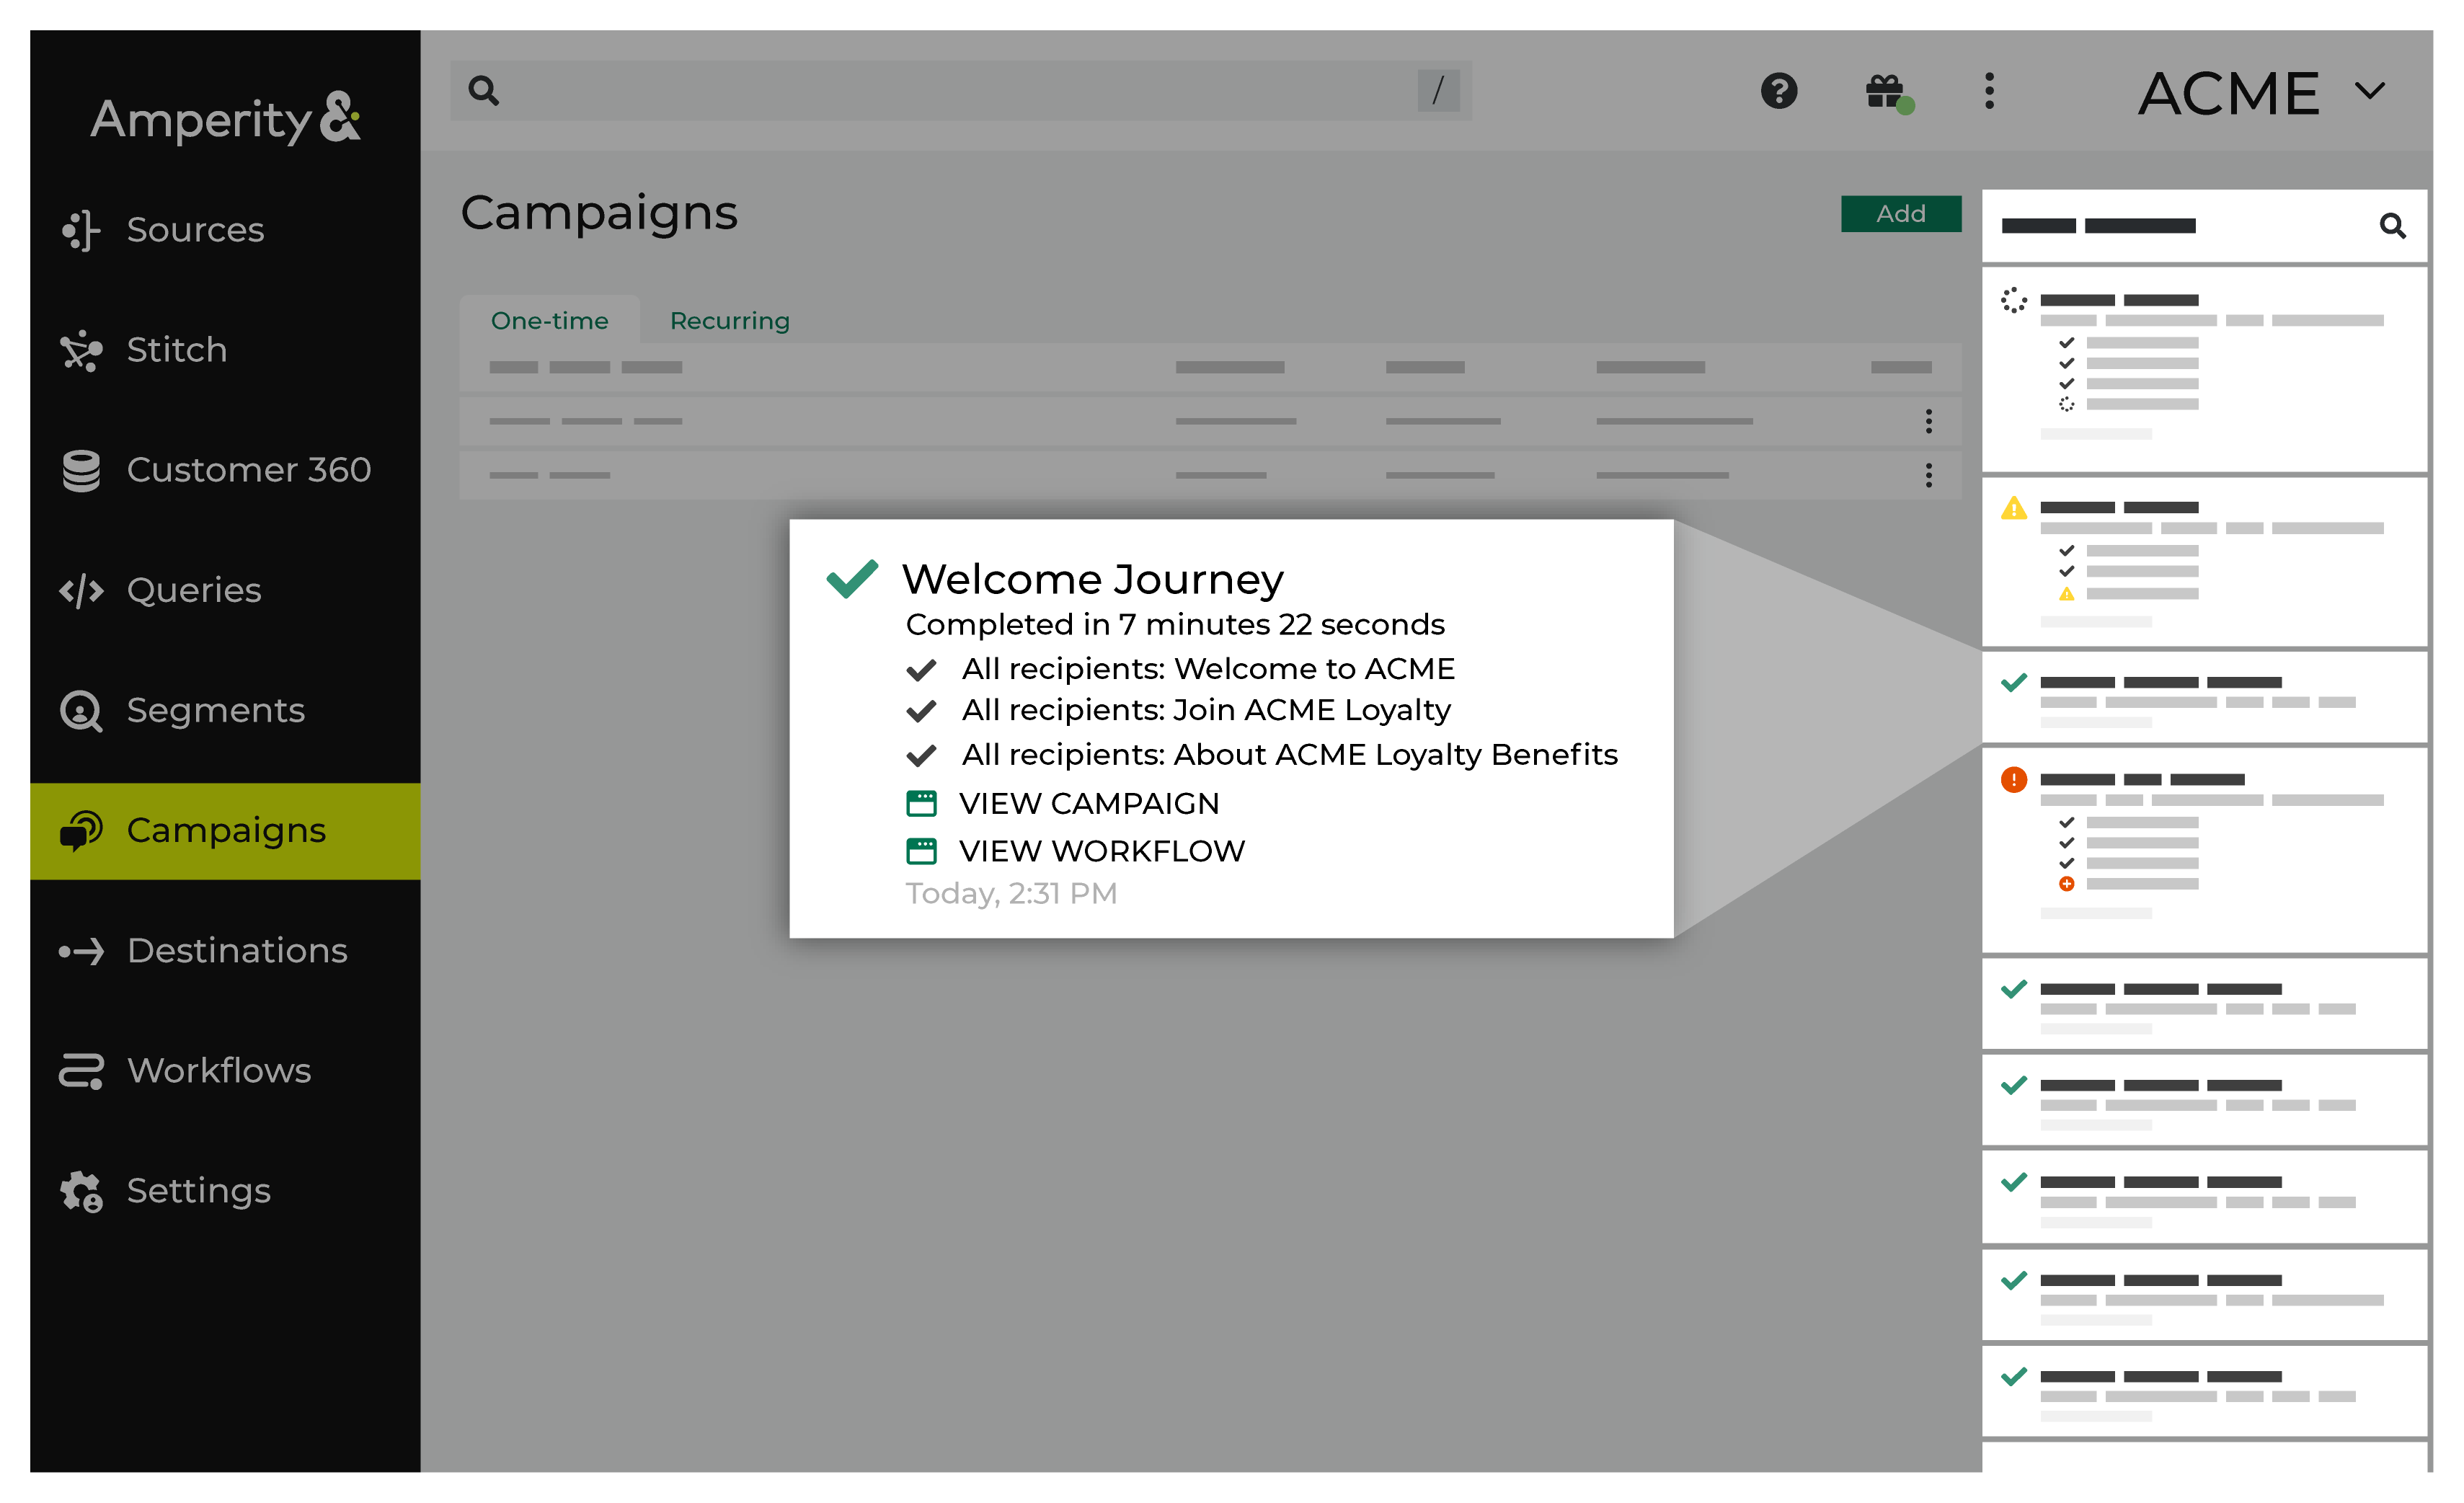
If a notification is about a non-successful outcome, the details for why and what happened can be found in the notification itself. Click More to view the full notification. Click View Workflow to open the workflow in the Workflows page.
In some cases viewing the log files may be helpful. In many cases, fix the root cause of the non-successful outcome, and then rerun the process manually. The Workflows page provides a set of workflow actions that you can initiate directly.
Common error notifications
Campaign error notifications are most often related to:
Campaign treatment delivery
Preparing the campaign audience
Running a segment
Sending a campaign downstream
If you see a campaign error notification, click the View Workflow link in that notification to open the workflow in the Workflows page, and then review all of the available workflow actions to determine which steps will help you best resolve the error.
Common status notifications
The following is a list of status notifications that appear within a notification as it is running or after it has completed:
Send for campaign started
Preparing campaign recipients
Sending to destinations
Completed in
Databases
Notifications for databases that run in the Customer 360 page appear after Amperity has processed data for that database. Notifications typically indicate successful outcomes. Less often, notifications contain details for non-successful outcomes, such as failures related to upstream or downstream processes.
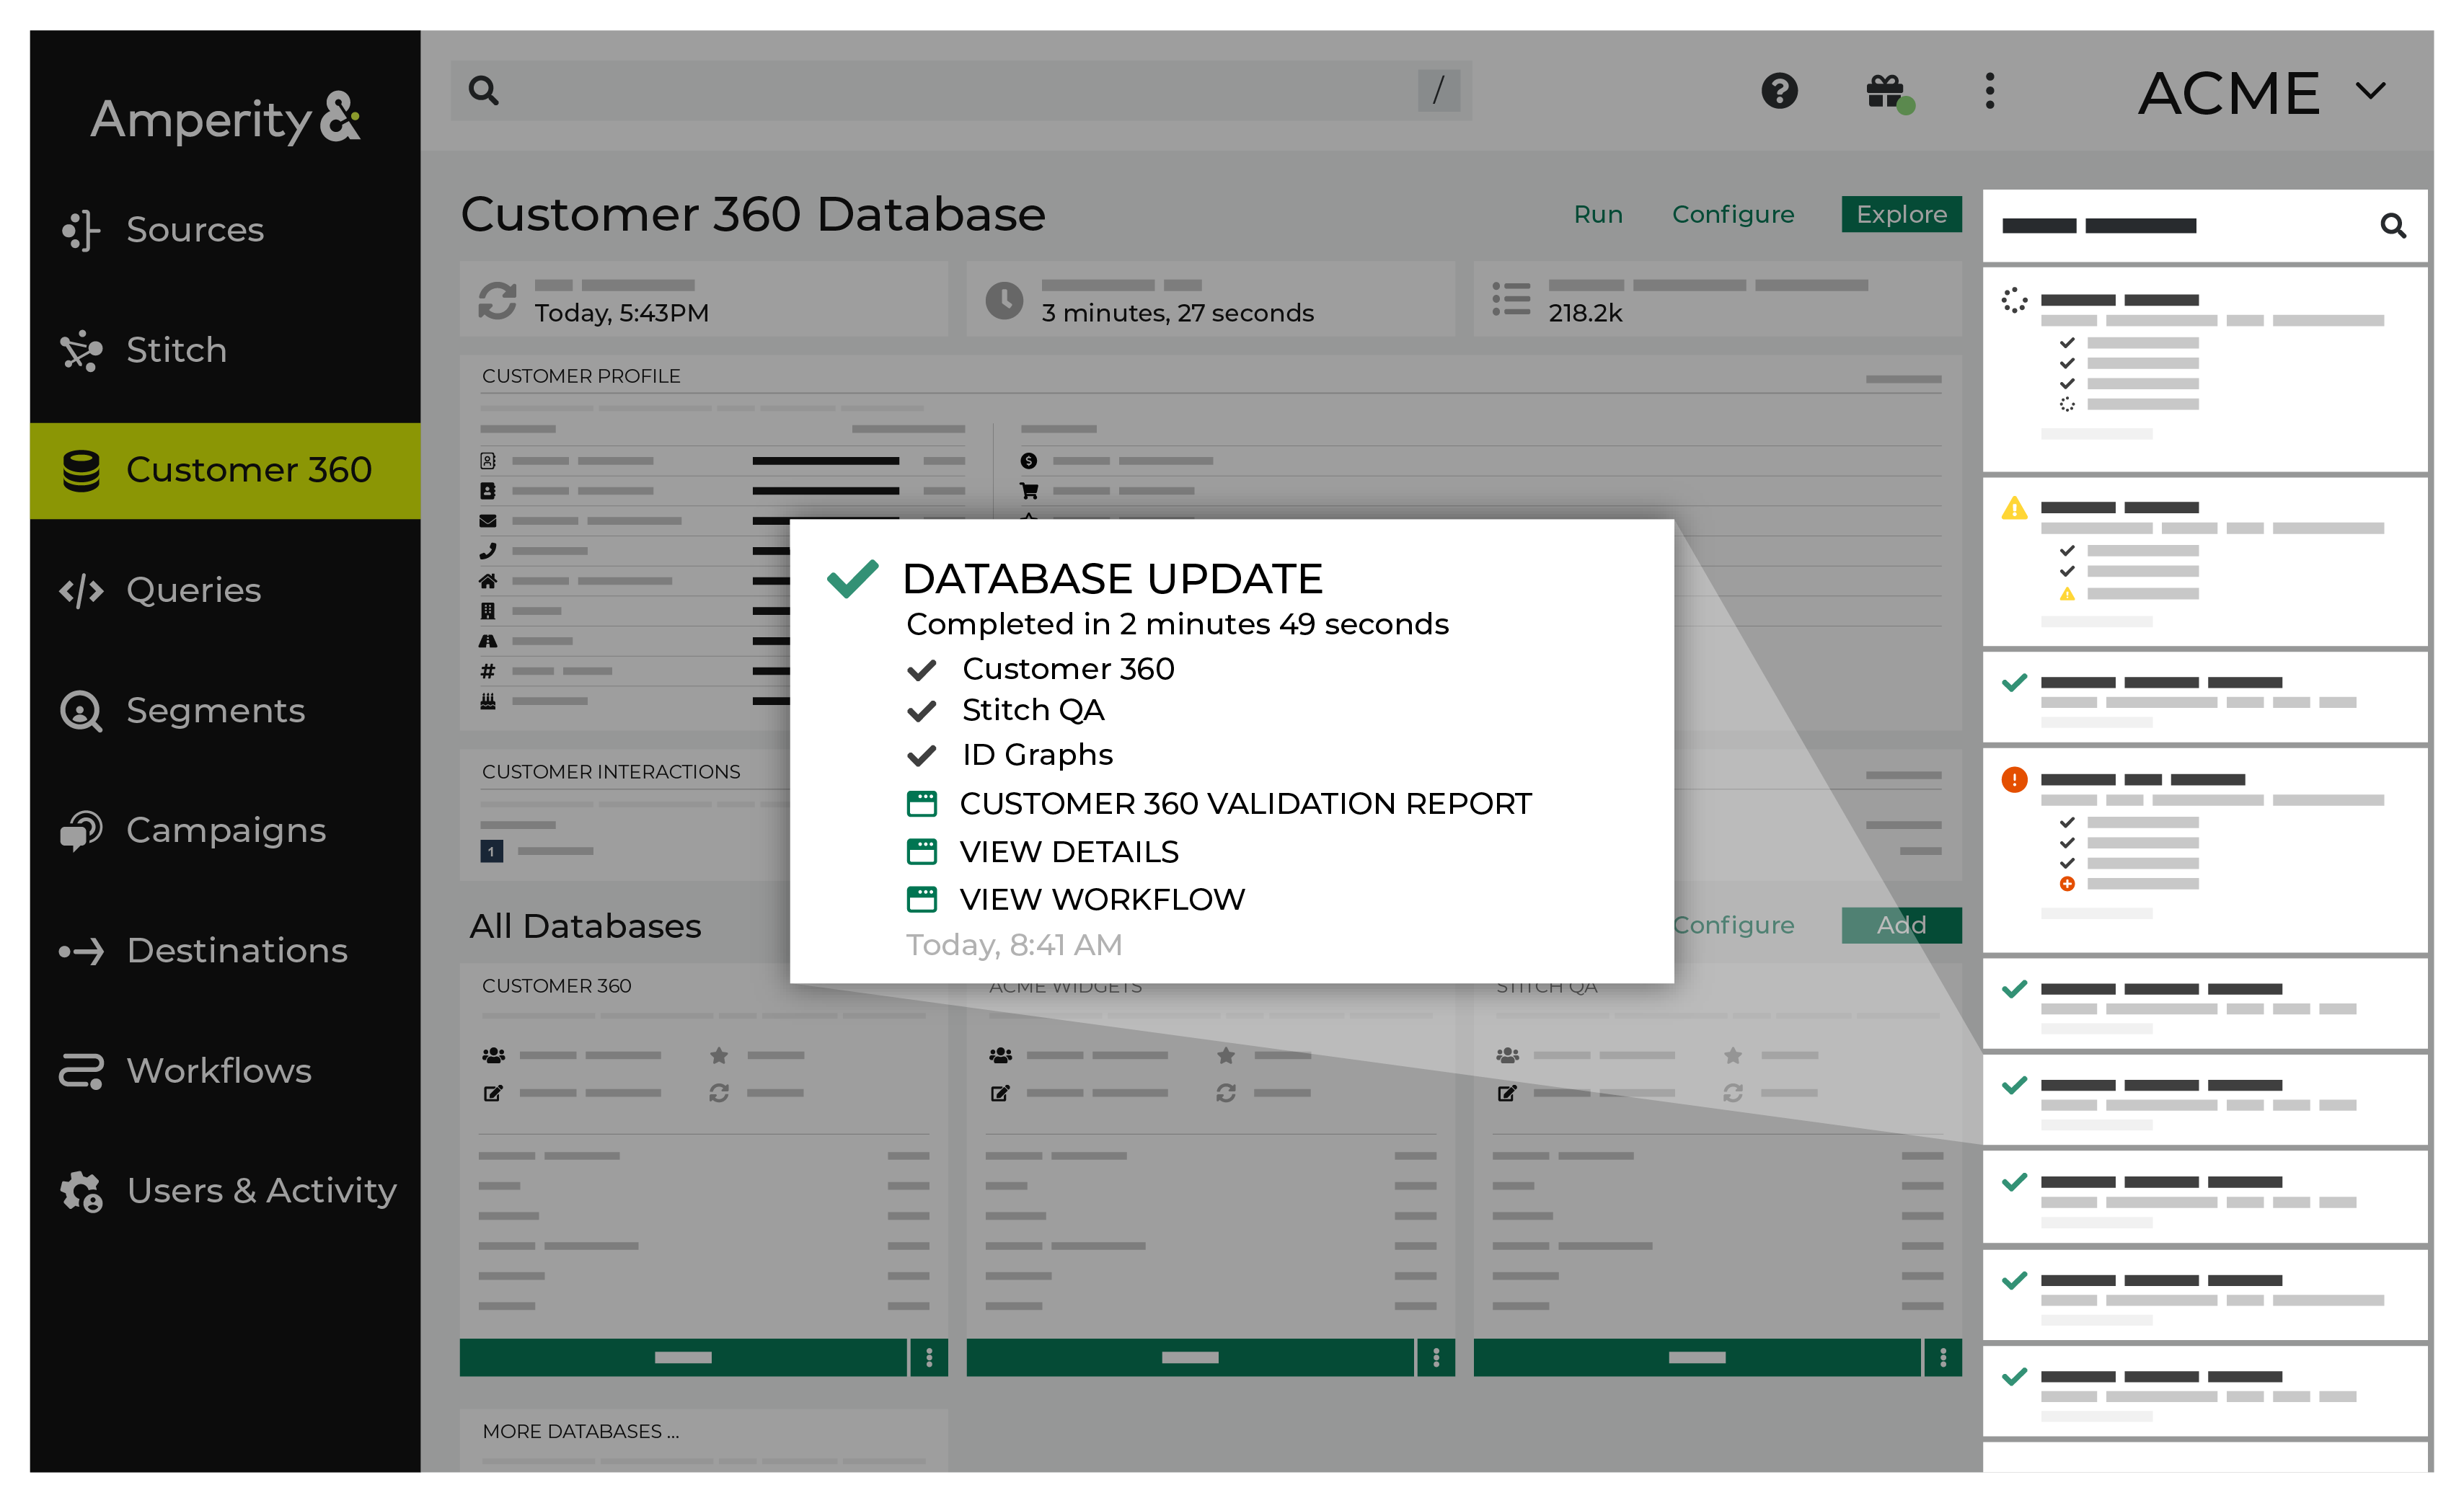
If a notification is about a non-successful outcome, the details for why and what happened can be found in the notification itself. Click More to view the full notification. Click View Workflow to open the workflow in the Workflows page.
In some cases viewing the log files may be helpful. In many cases, fix the root cause of the non-successful outcome, and then rerun the process manually. The Workflows page provides a set of workflow actions that you can initiate directly.
Common error notifications
Database error notifications are most often related to:
Error while publishing databases
Query error found
If you see a databases error notification, click the View Workflow link in that notification to open the workflow in the Workflows page, and then review all of the available workflow actions to determine which steps will help you best resolve the error.
Common status notifications
The following is a list of status notifications that appear within a notification as it is running or after it has completed:
Build started
Build in progress
Batch created
Batch started
Batch completed
Waiting to start publishing
Publishing in progress
Publishing started
Publishing succeeded
Waiting to start
Generation in progress
Generation completed
Database generation may be waiting
Database generation aborted
Starting database validation
Running database validation
Completed in
Orchestrations
Notifications for the Orchestrations page appear after Amperity added an orchestration to an active query or for a database export. Less often, notifications contain details for non-successful outcomes, such as failures related to upstream or downstream processes.
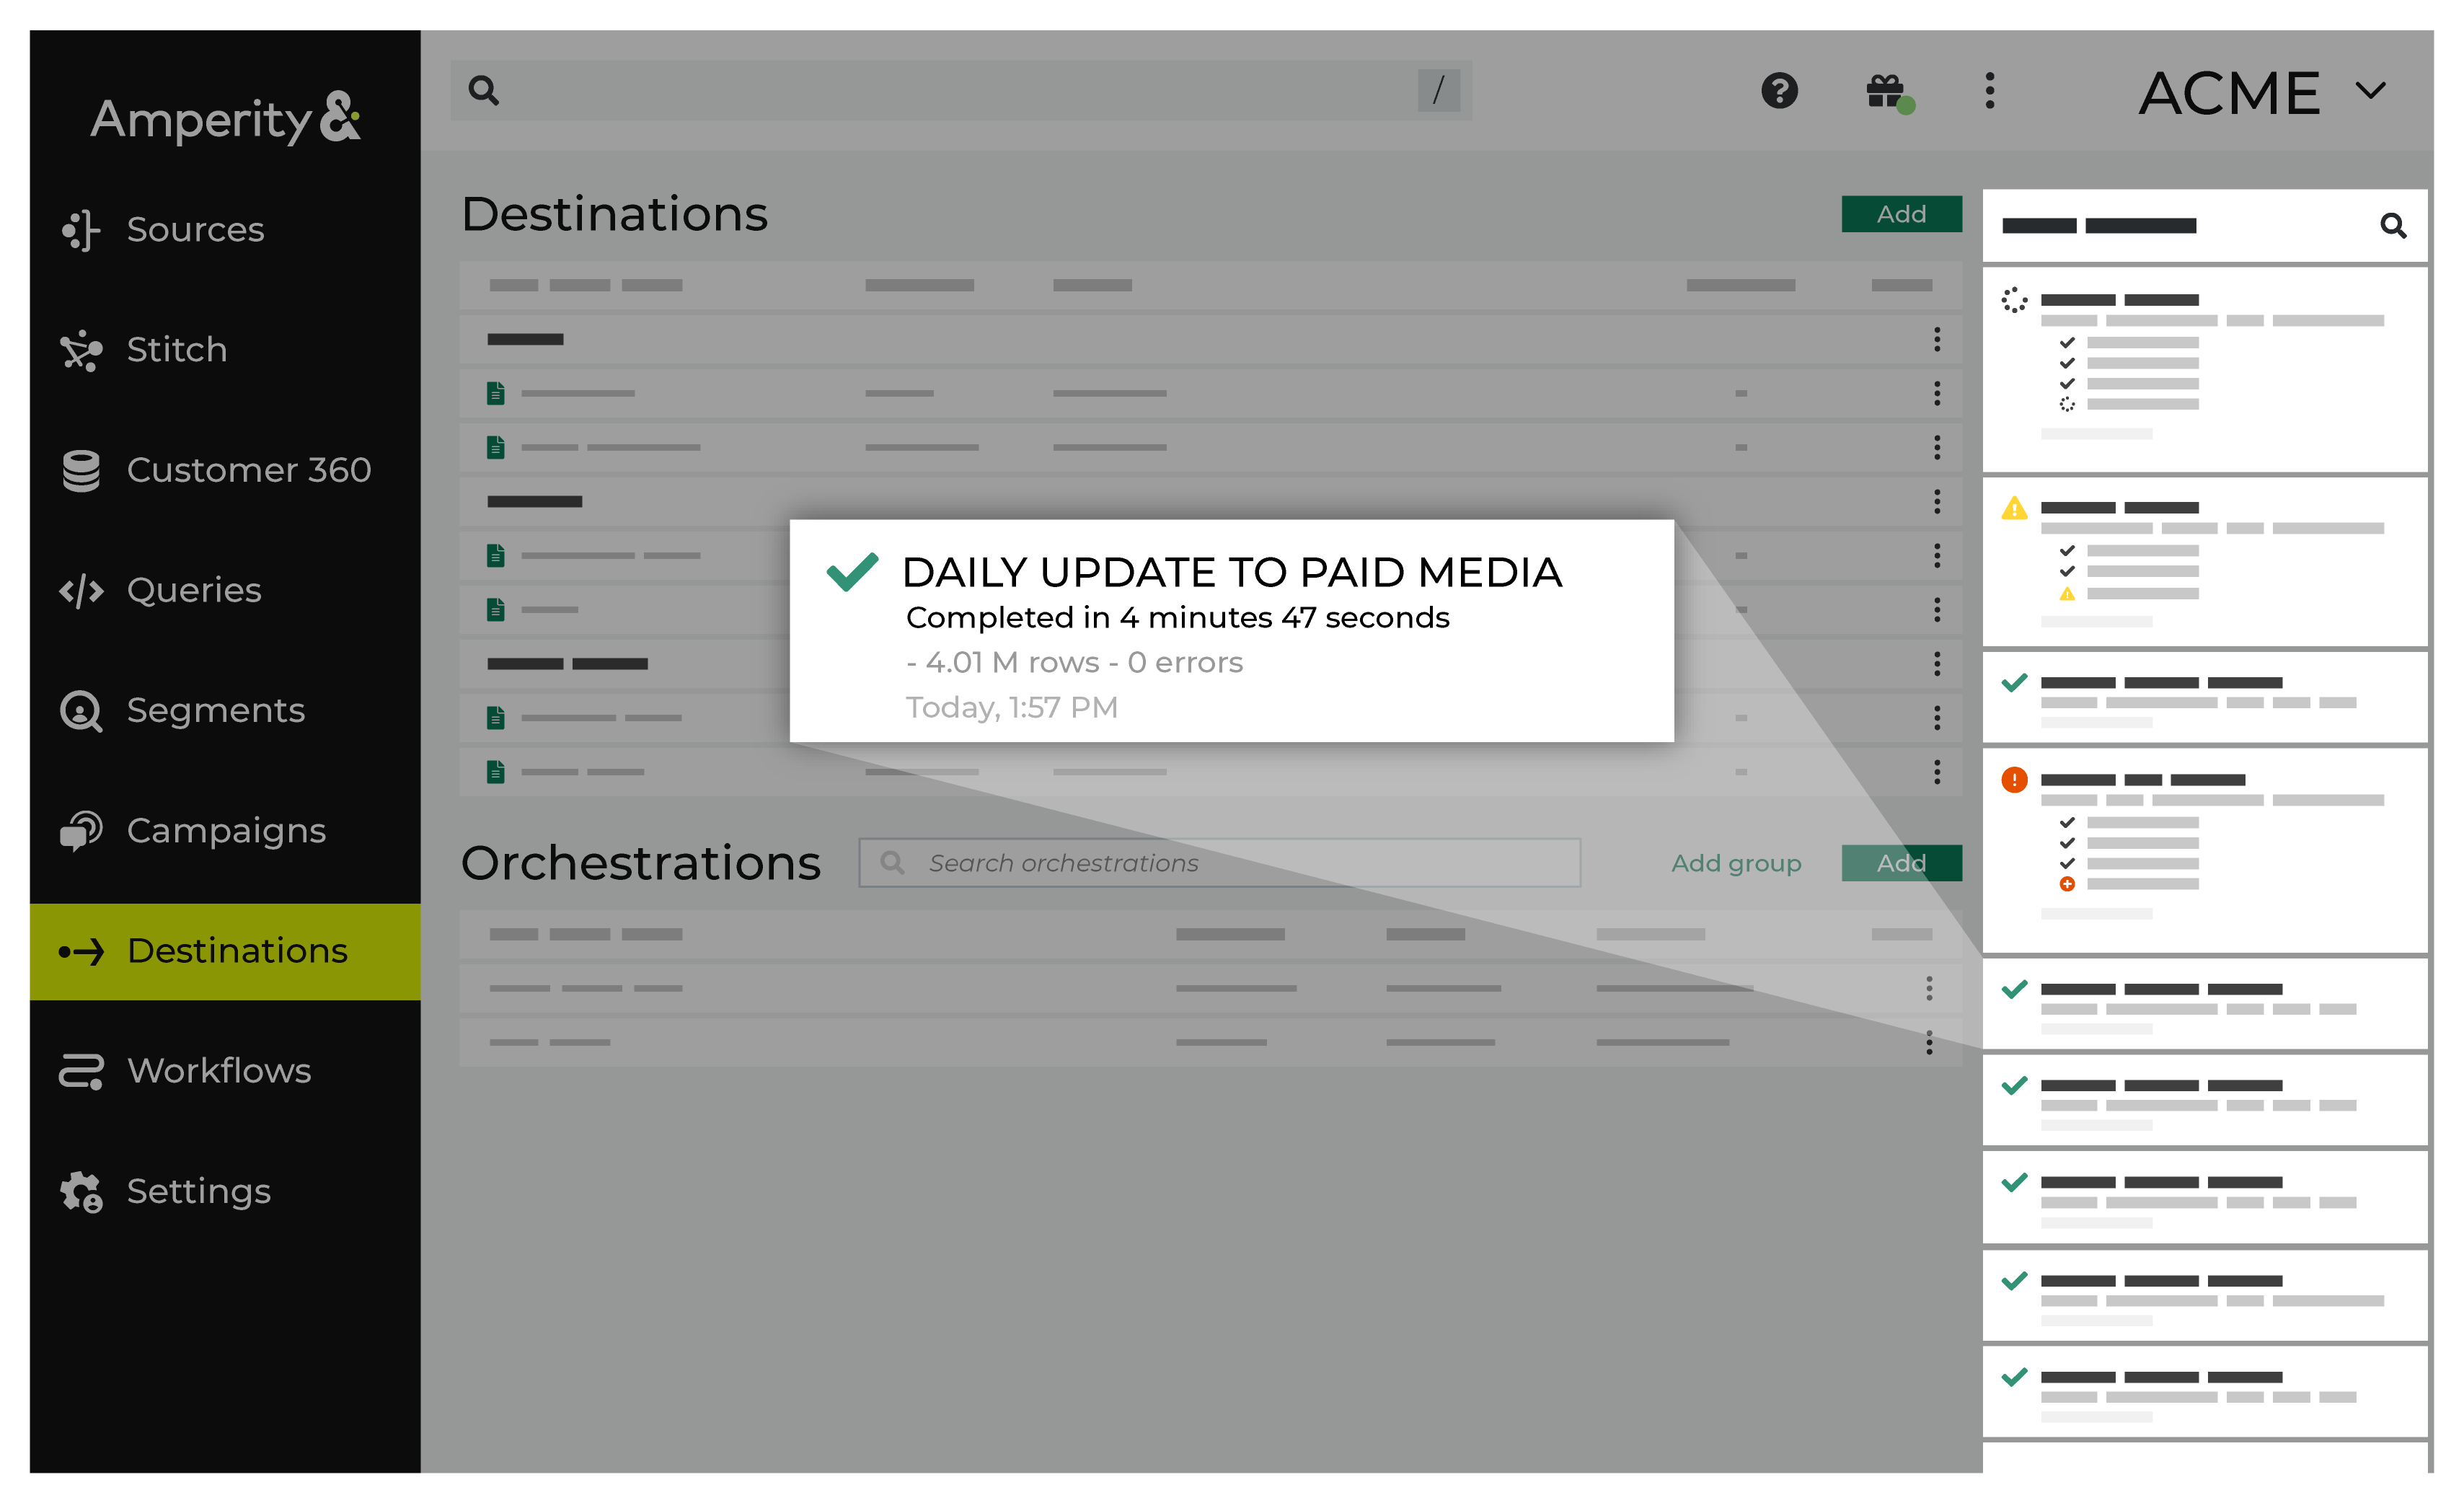
If a notification is about a non-successful outcome, the details for why and what happened can be found in the notification itself. Click More to view the full notification. Click View Workflow to open the workflow in the Workflows page.
In some cases viewing the log files may be helpful. In many cases, fix the root cause of the non-successful outcome, and then rerun the process manually. The Workflows page provides a set of workflow actions that you can initiate directly.
Common error notifications
Orchestration error notifications are most often related to:
Data type mismatches
Running a query
Sending an orchestration downstream
If you see an orchestration error notification, click the View Workflow link in that notification to open the workflow in the Workflows page, and then review all of the available workflow actions to determine which steps will help you best resolve the error.
Common status notifications
The following is a list of status notifications that appear within a notification as it is running or after it has completed:
Waiting to start
Orchestration group jobs created
Orchestration group run requested
Orchestration run requested
Orchestration started
Orchestration progress
Waiting to upload
Uploading
Orchestration completed
Completed in
Queries
Notifications for the Queries page appear after Amperity has processed a query and passed the results to a downstream process. Notifications typically indicate successful outcomes. Less often, notifications contain details for non-successful outcomes, such as failures related to upstream or downstream processes.
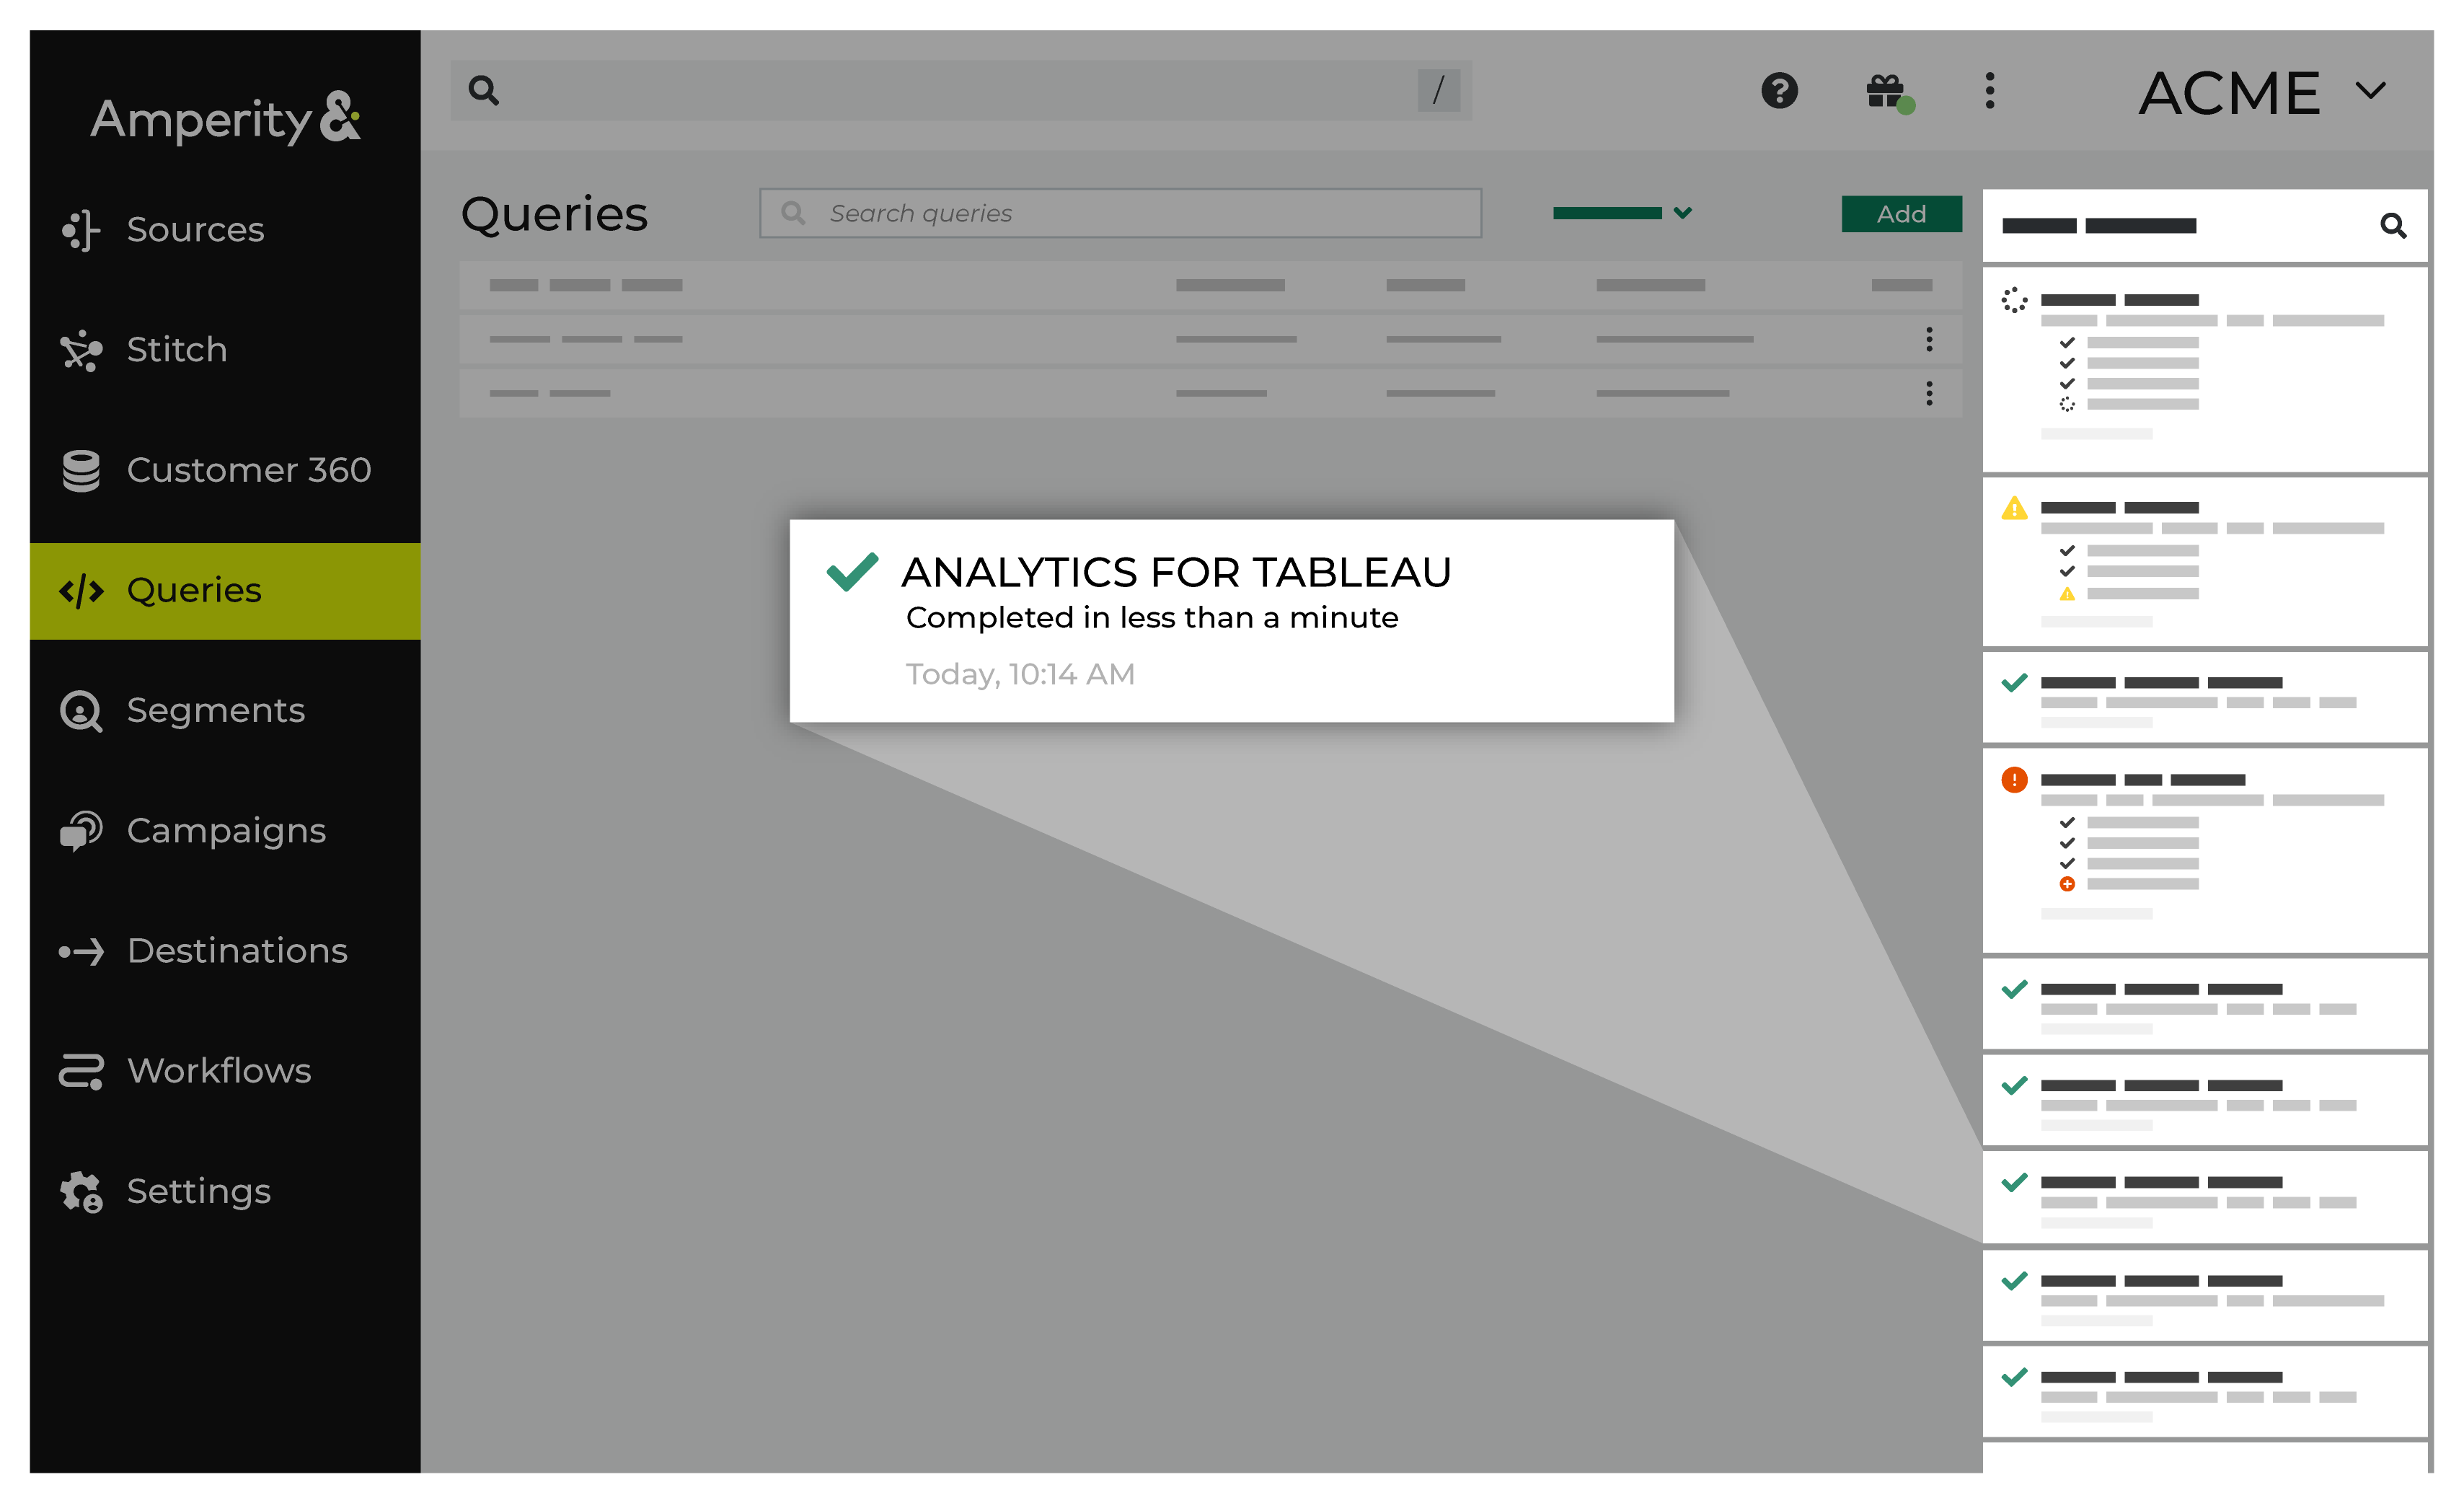
If a notification is about a non-successful outcome, the details for why and what happened can be found in the notification itself. Click More to view the full notification. Click View Workflow to open the workflow in the Workflows page.
In some cases viewing the log files may be helpful. In many cases, fix the root cause of the non-successful outcome, and then rerun the process manually. The Workflows page provides a set of workflow actions that you can initiate directly.
Common error notifications
Query error notifications are most often related to:
Syntax errors
Upstream and downstream dependencies
Queries that return large results sets
Note
For queries that return large results sets, do the following:
Review the query and look for ways to optimize the SQL so that it returns smaller results sets.
Configure the query to run in performance mode. This wraps a CREATE TABLE operation around the SELECT statement in the query, writes the results to an Apache Parquet file, and then makes that file available to Amperity as a table. Queries that run in performance mode can have limitations.
If you see a query error notification, click the View Workflow link in that notification to open the workflow in the Workflows page, and then review all of the available workflow actions to determine which steps will help you best resolve the error.
Common status notifications
The following is a list of status notifications that appear within a notification as it is running or after it has completed:
Activating a query
Activated query
Running a query
Completed in
Sources
You can find information about notifications–per status–found on the Sources page listed below.
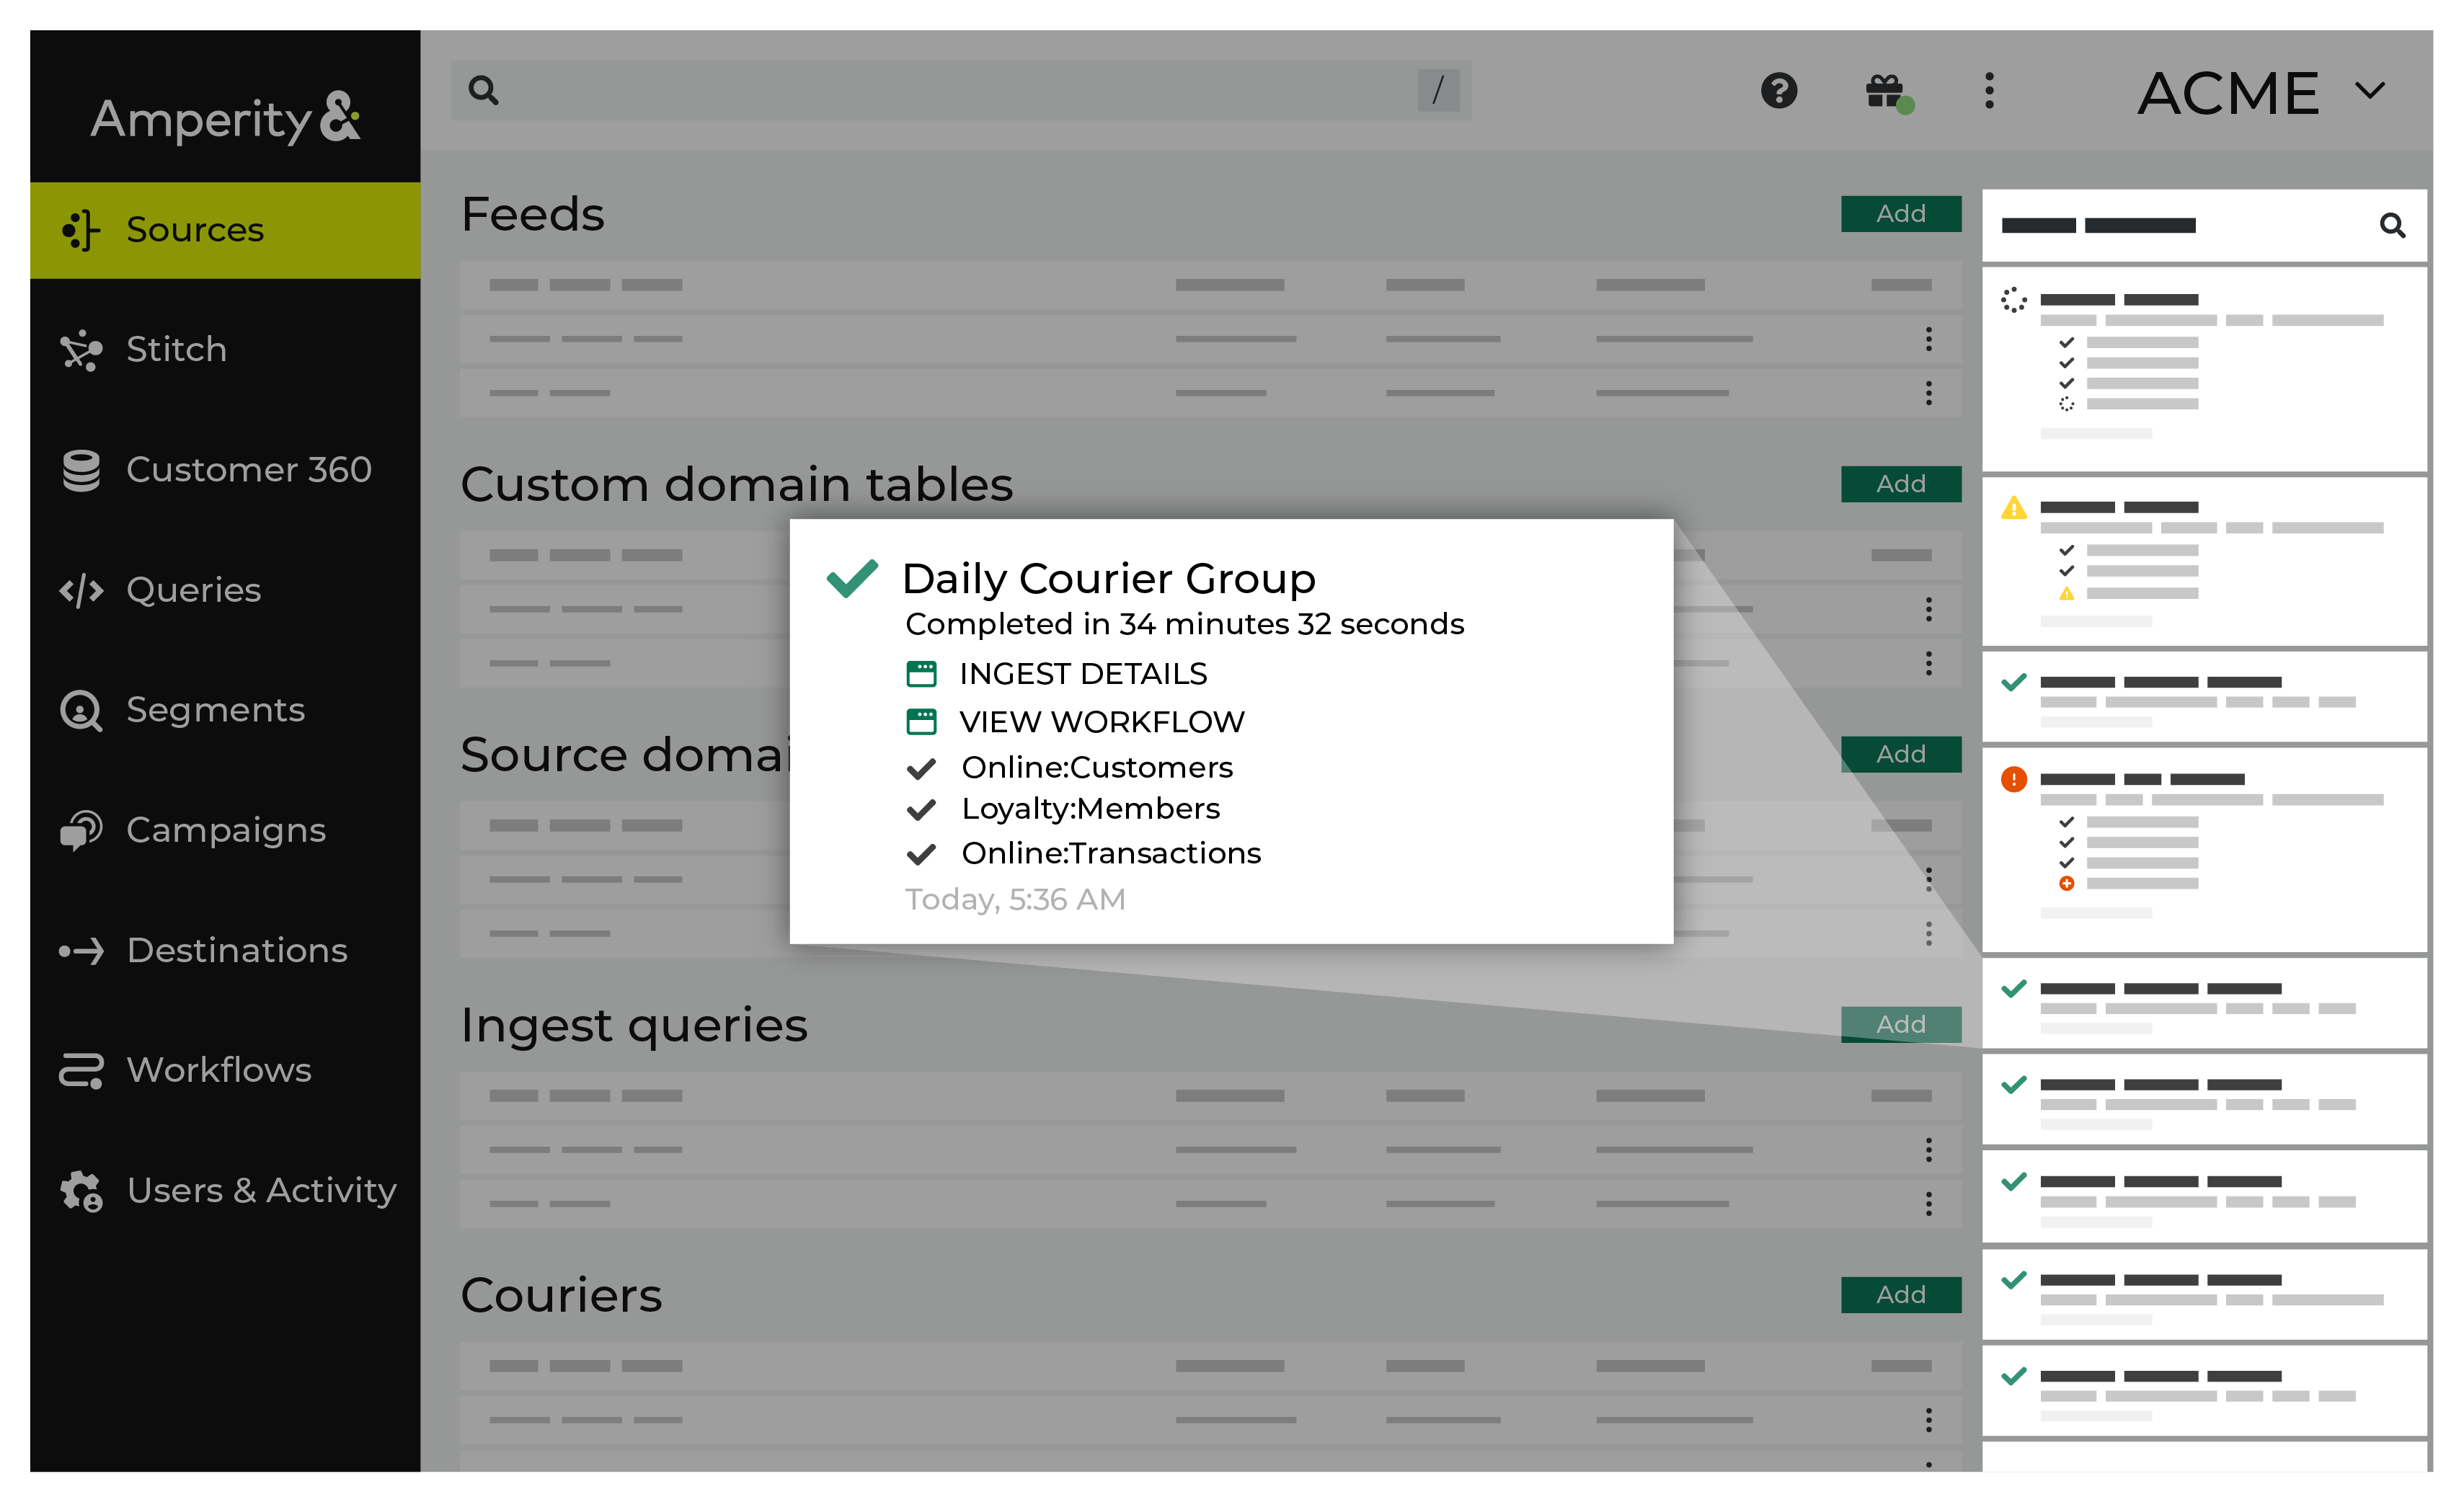
Common error notifications
Source error notifications are most often related to:
Ingesting data
Running a courier
Data type mismatch with a feed
If you see a source error notification, click the View Workflow link in that notification to open the workflow in the Workflows page, and then review all of the available workflow actions to determine which steps will help you best resolve the error.
Common status notifications
The following is a list of status notifications that appear within a notification as it is running or after it has completed:
Courier group run request
Courier run request
Courier sensor created
Sensor created
Sensor running
Sensor completed
Courier sensor process completed
Courier batch started
Courier job started
Waiting for source data
Loading data
Ingest requested
Ingest started
Ingest feed progress
Ingest files progress
Committing domain transactions
Domain transaction closed
Courier batch completed
Courier job completed
Courier process completed
Completed in
Stitch reports
Notifications for Stitch reports that run in the Stitch page appear after Amperity creates clusters of records based on the connection between pairs, and then gives each cluster a unique Amperity ID. Notifications typically indicate successful outcomes. Less often, notifications contain details for non-successful outcomes, such as failures related to upstream or downstream processes.
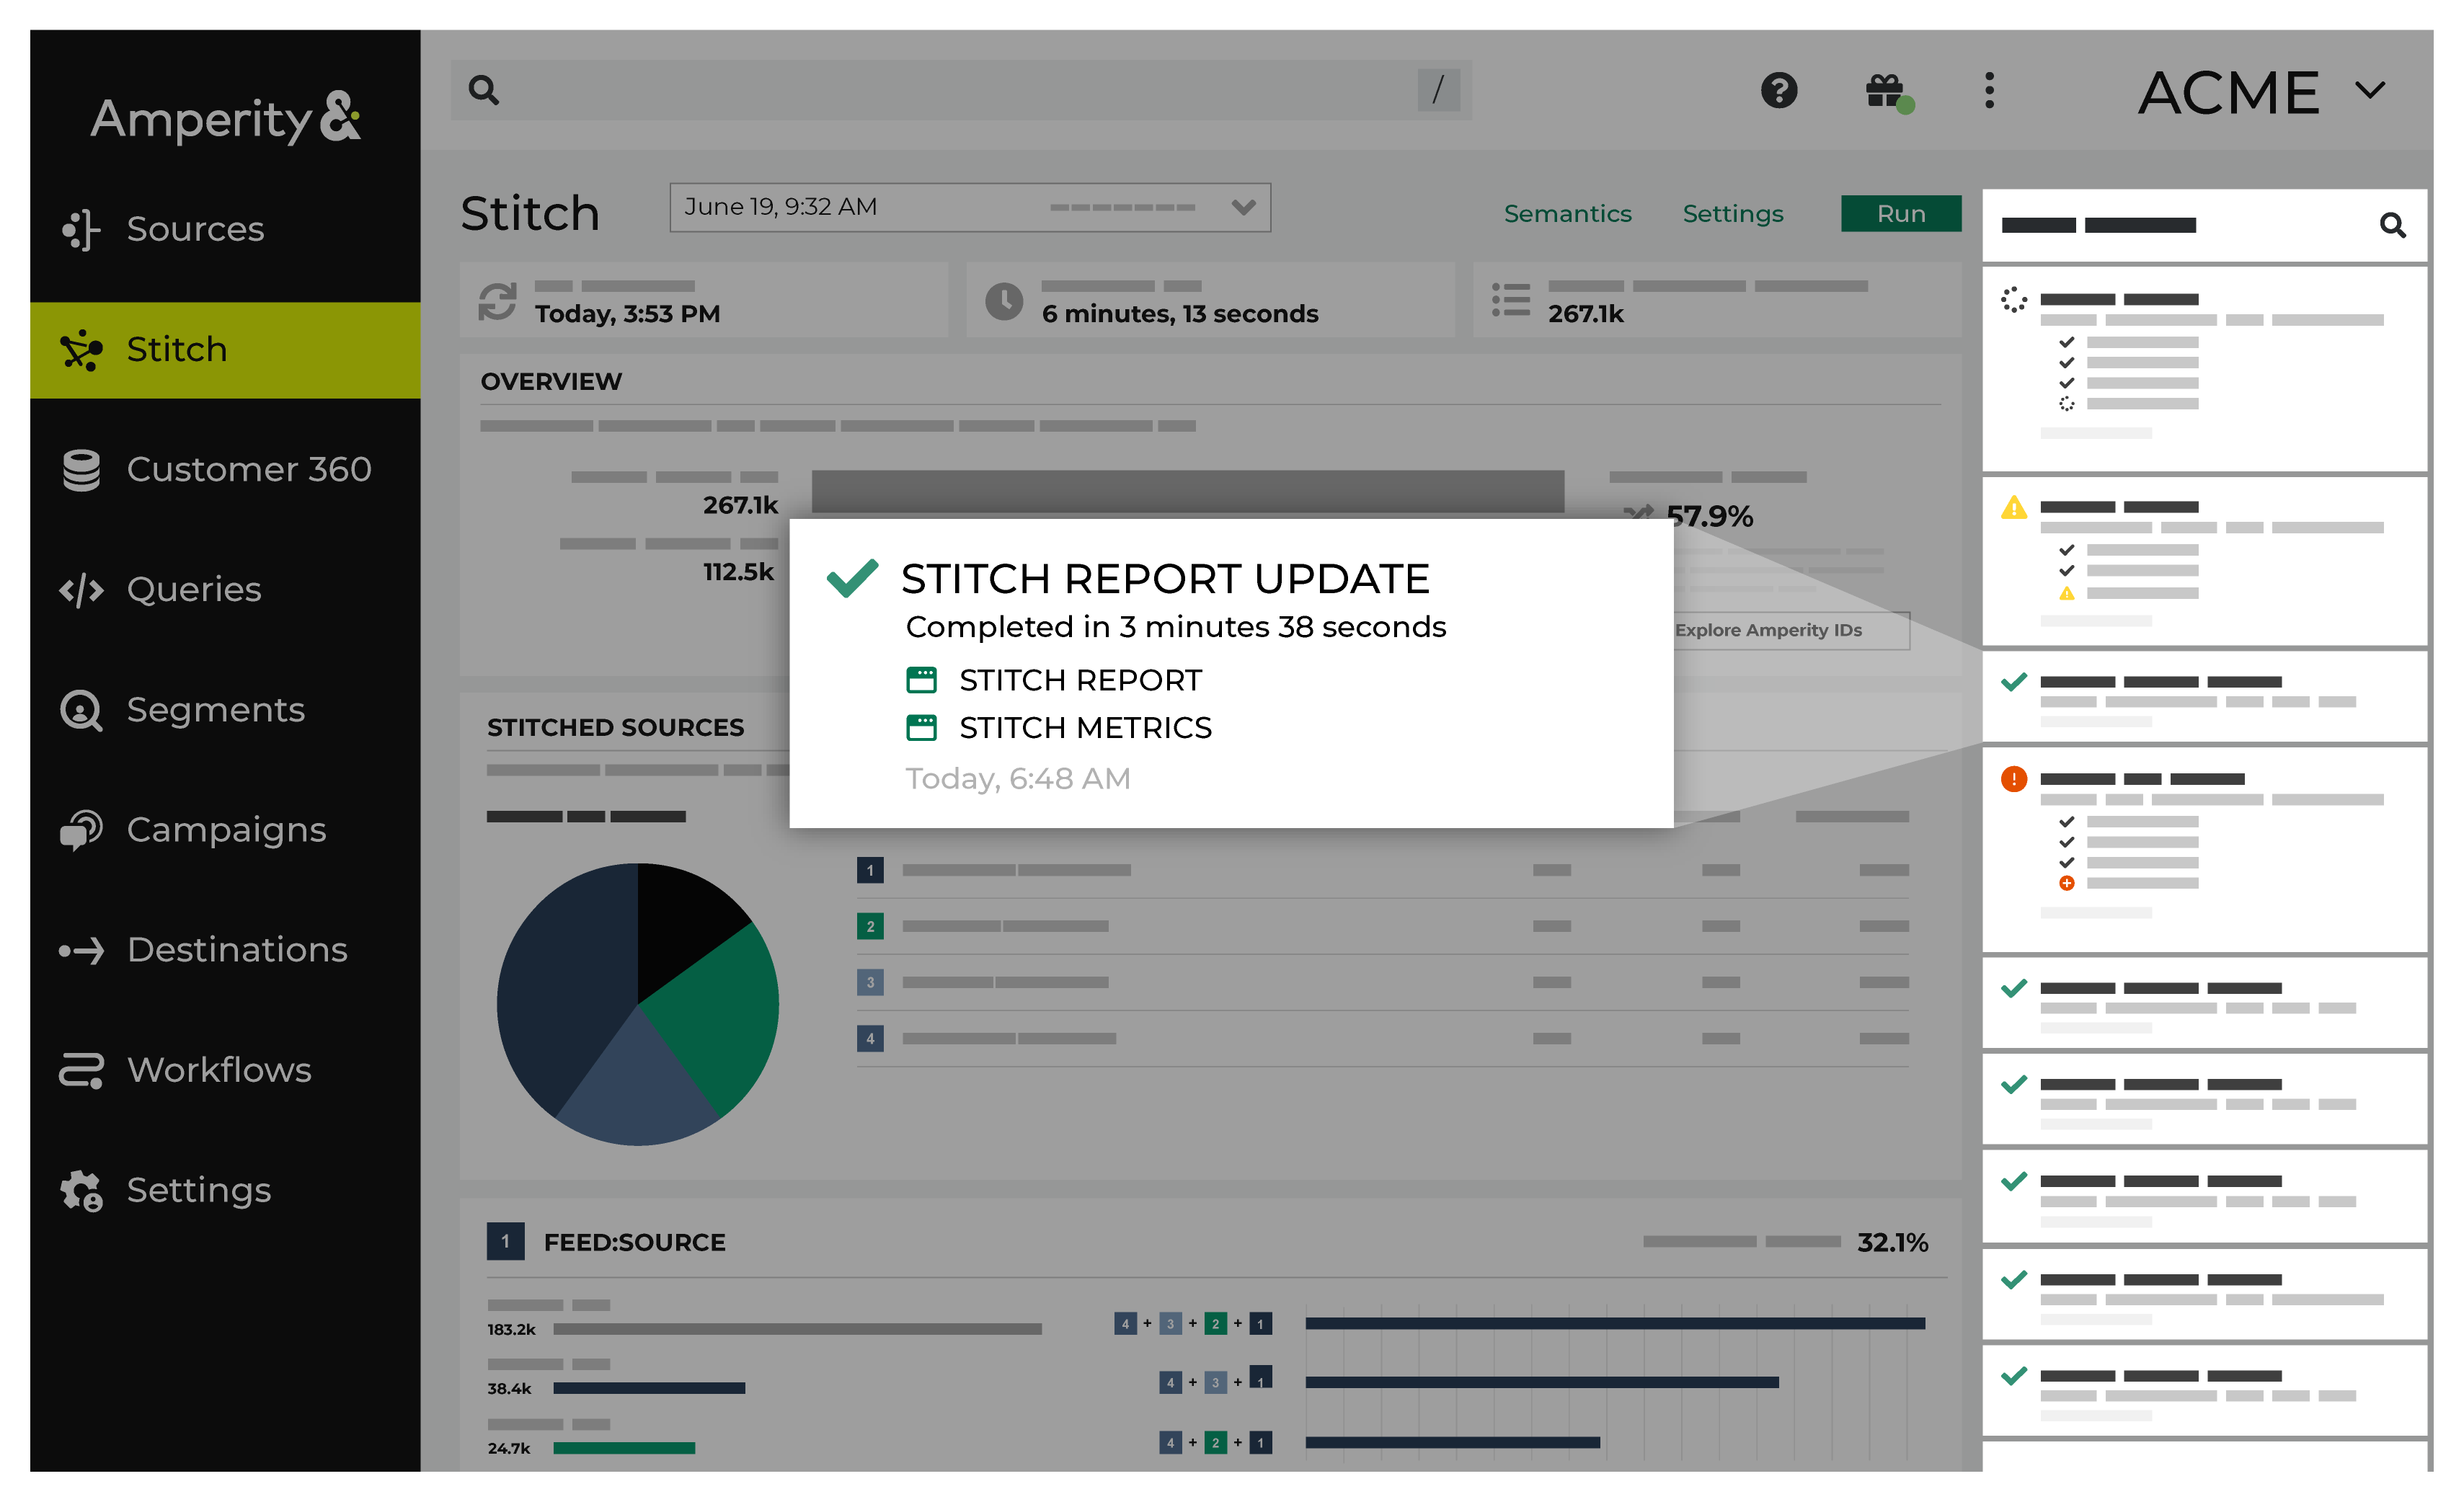
If a notification is about a non-successful outcome, the details for why and what happened can be found in the notification itself. Click More to view the full notification. Click View Workflow to open the workflow in the Workflows page.
In some cases viewing the log files may be helpful. In many cases, fix the root cause of the non-successful outcome, and then rerun the process manually. The Workflows page provides a set of workflow actions that you can initiate directly.
Common error notifications
Stitch report error notifications are most often related to issues with generating the Stitch report.
If you see a Stitch report error notification, click the View Workflow link in that notification to open the workflow in the Workflows page, and then review all of the available workflow actions to determine which steps will help you best resolve the error.
Common status notifications
The following is a list of status notifications that appear within a notification as it is running or after it has completed:
Generating report
Stitch report started
Stitch report ended
Completed in
Stitch runs
Notifications for Stitch reports that run in the Stitch page appear after Amperity creates clusters of records based on the connection between pairs, and then gives each cluster a unique Amperity ID. Notifications typically indicate successful outcomes. Less often, notifications contain details for non-successful outcomes, such as failures related to upstream or downstream processes.
If a notification is about a non-successful outcome, the details for why and what happened can be found in the notification itself. Click More to view the full notification. Click View Workflow to open the workflow in the Workflows page.
In some cases viewing the log files may be helpful. In many cases, fix the root cause of the non-successful outcome, and then rerun the process manually. The Workflows page provides a set of workflow actions that you can initiate directly.
Common error notifications
Stitch run error notifications are most often related to:
Issues with loading data to Stitch
Mismatch between fields and data types in custom tables and tables already loaded to Stitch
Issues with steps within the Stitch process
If you see a Stitch error notification, click the View Workflow link in that notification to open the workflow in the Workflows page, and then review all of the available workflow actions to determine which steps will help you best resolve the error.
Common status notifications
The following is a list of status notifications that appear within a notification as it is running or after it has completed:
Waiting to start
Stitch requested
Loading data
Running custom domain tables
Processing Stitch request
Stitch skipped - no work to do
Spark job submitted
Starting Stitch job
Stitch started
Indexing records
Indexing completed
Running table union
Union completed
Clustering records
Sampling records
Forming distinct pairs
Clustering completed
Assigning stable IDs
Stable IDs assigned
Stitch tables generated
Writing Stitch tables
Stitch completed
Generating Stitch metrics
Writing Stitch metrics
Stitch metrics generated
Completed in
How-tos
Tasks available to notifications:
Open the Workflows page
You should resolve warnings and errors from the Workflows page.
To open the Workflows page from a warning or error notification
On the recent activity pane, click More for a notification with a warning or an error.
Click View Workflow. This opens the Workflows page to the workflow for this notification.
Find, and then open, the rows that contain warnings or errors, and then work to resolve them.
Tip
Use the provided workflow actions to resolve an error.
Resolve workflow errors
You can resolve an error in a workflow on the Workflows page.
To view a workflow
On the recent activity pane or the Search Recent Notifications window, in the desired notification, click on the View Workflow link.
On the Workflows page, click Show Resolutions.
On the Resolve Error, select the resolution option in the Resolution section.
Click Resolve.
The system runs the selected resolution.