Review identity resolution
Identity resolution is the process of connecting and matching data points that exist in many sources to build a unified view of a single customer.
Identity resolution is a critical step in understanding who your customers are. Stitch is the component within Amperity that performs identity resolution by comparing all of your customer data, identifying unifying groups of customer records, and then identifying unique customer profiles that represent each of your unique, individual customers.
Identity resolution summary
Identity resolution is the process of connecting and matching data points that exist in many sources to build a unified view of a single customer.
The Summary tab on the Stitch page shows the results of identity resolution and how it adapts and changes over time.
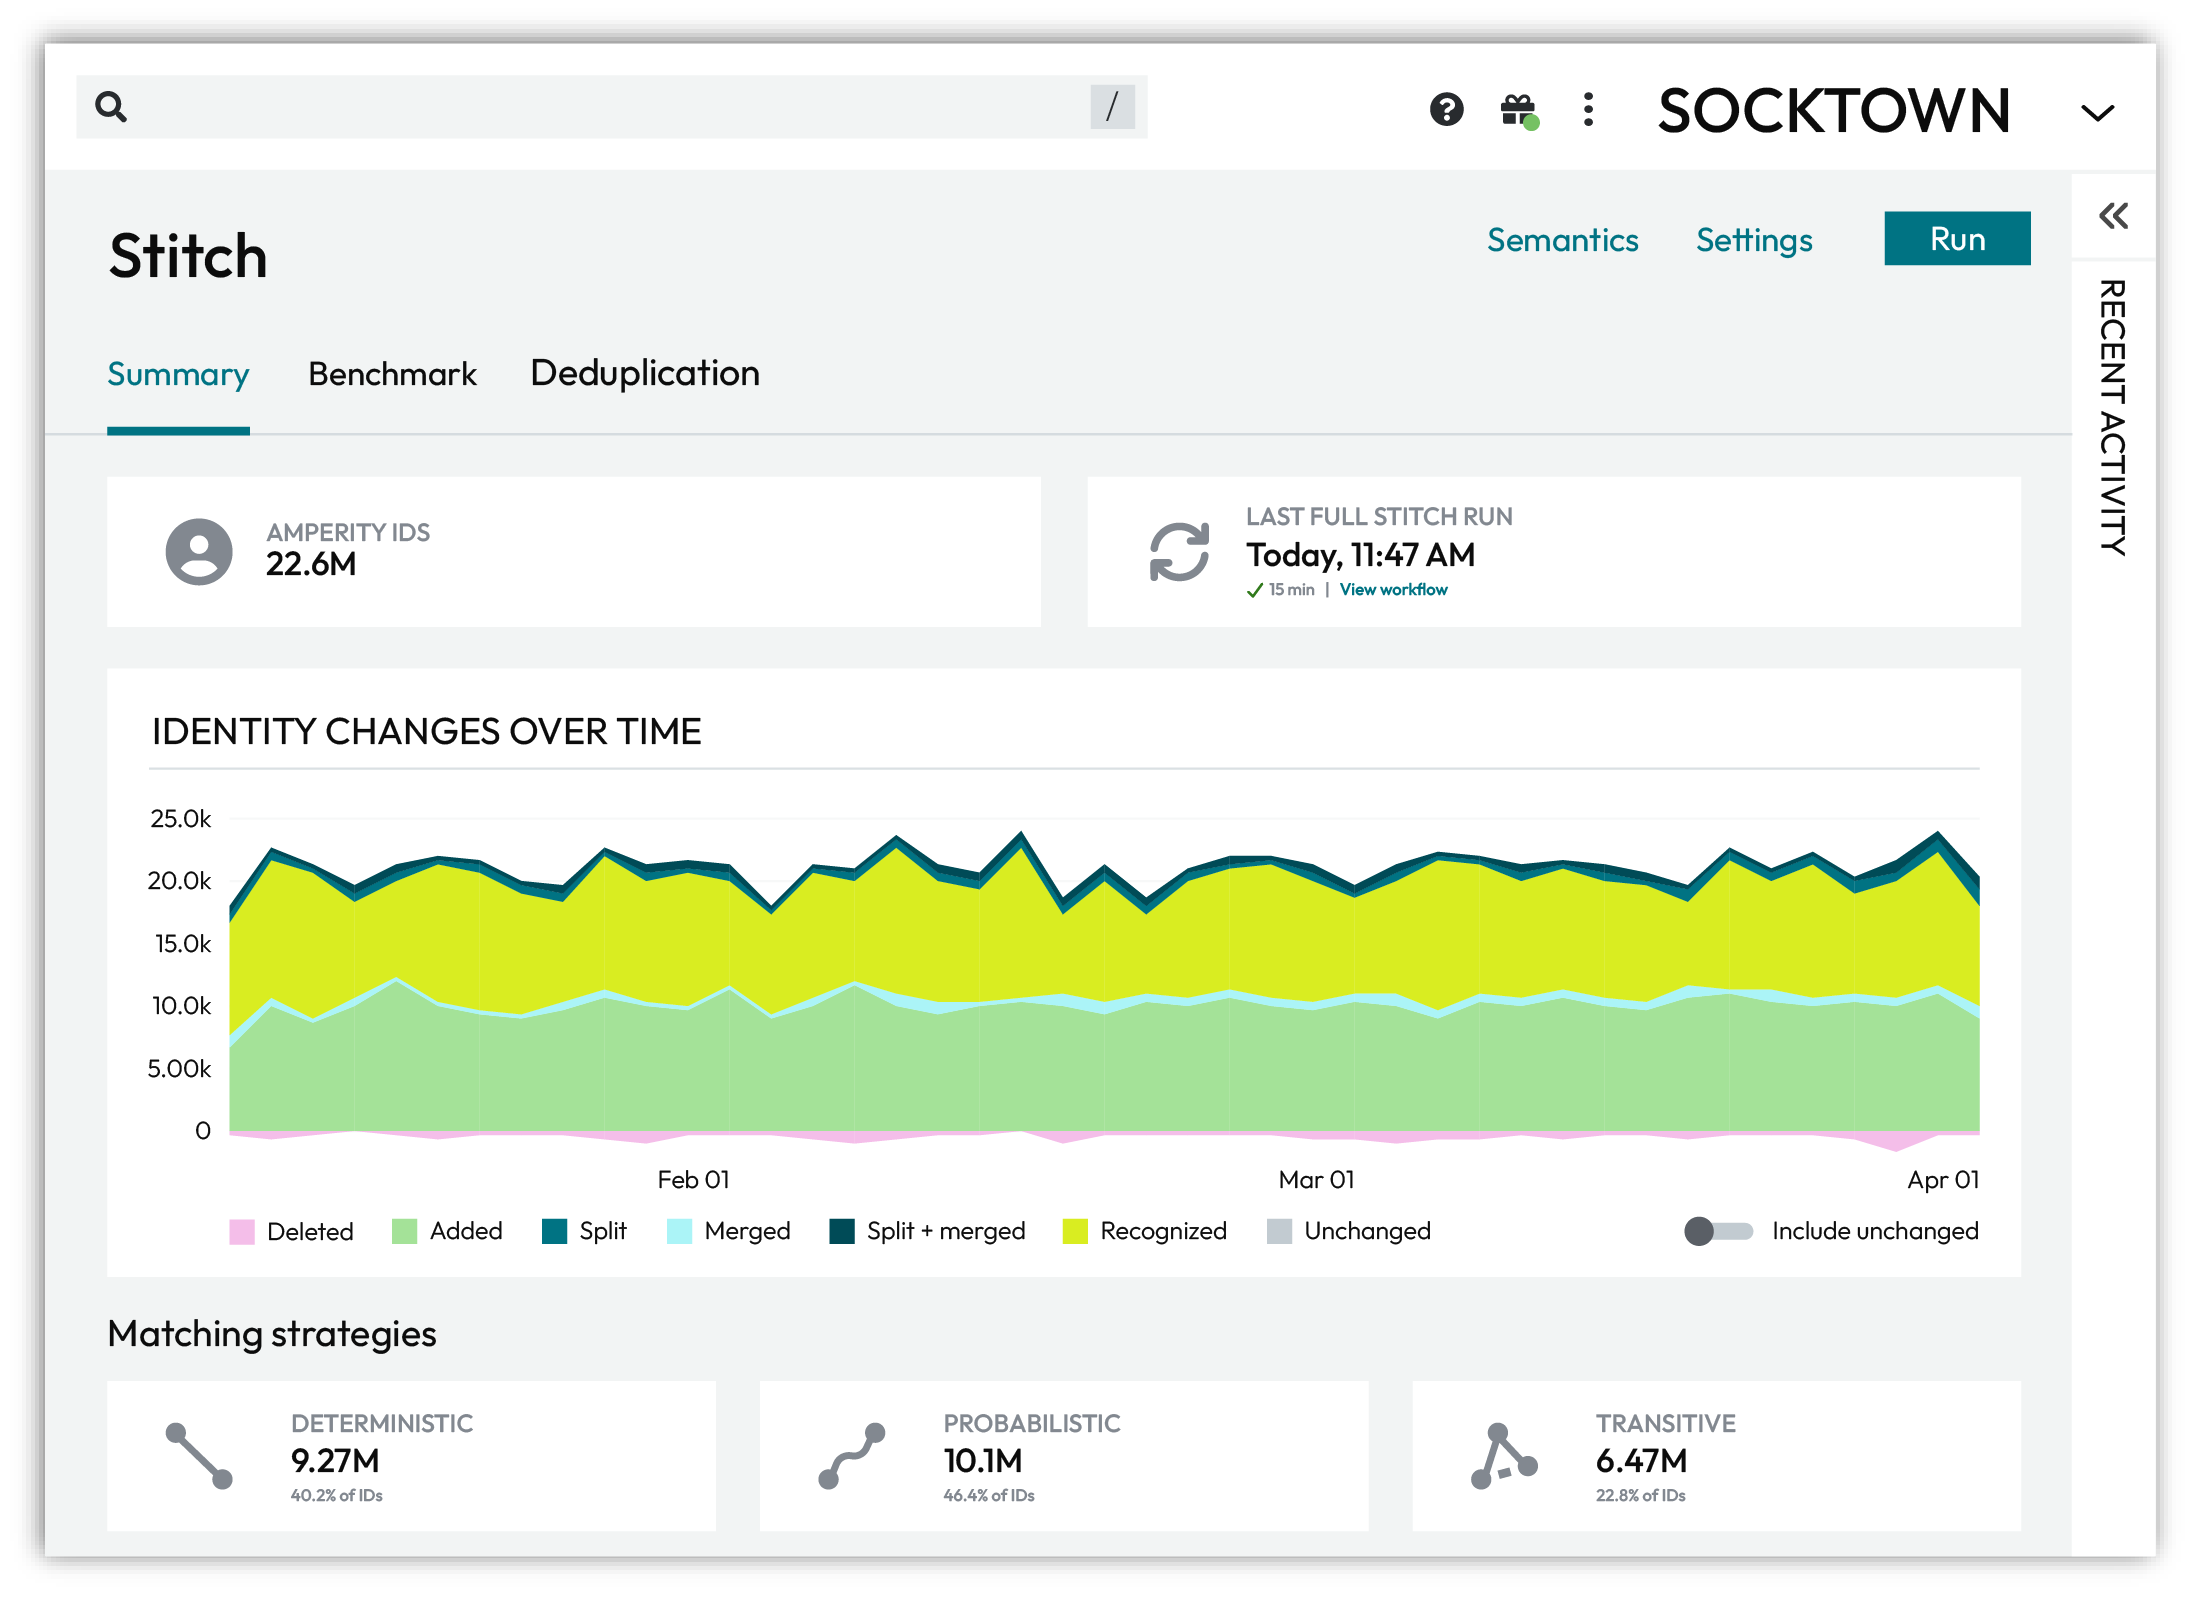
The Summary tab shows:
The number of unique customer profiles assigned an Amperity ID.
An Amperity ID is a unique identifier assigned to a cluster of records within an identity graph. Each Amperity ID represents all of the records within a customer profile.
The last time a full Stitch run completed.
A graph for viewing how identity changes over time.
The percentage of profiles associated with deterministic, probabilistic, and transitive matching strategies.
The complexity of customer profiles based on the number of records in profiles, sorted by 1, 2, 3, 4, 5-10, 11-15, 16-20, 21-25, and 26+ records.
Identity changes over time
Adaptive identity is the process of building an identity graph that forms the foundation of customer profiles and defines a keychain of identifiers. Activate customer profiles for marketing campaigns and journeys. Integrate these profiles with other operational systems. Identity recognition uses a keychain to associate real-time events to known customer profiles.
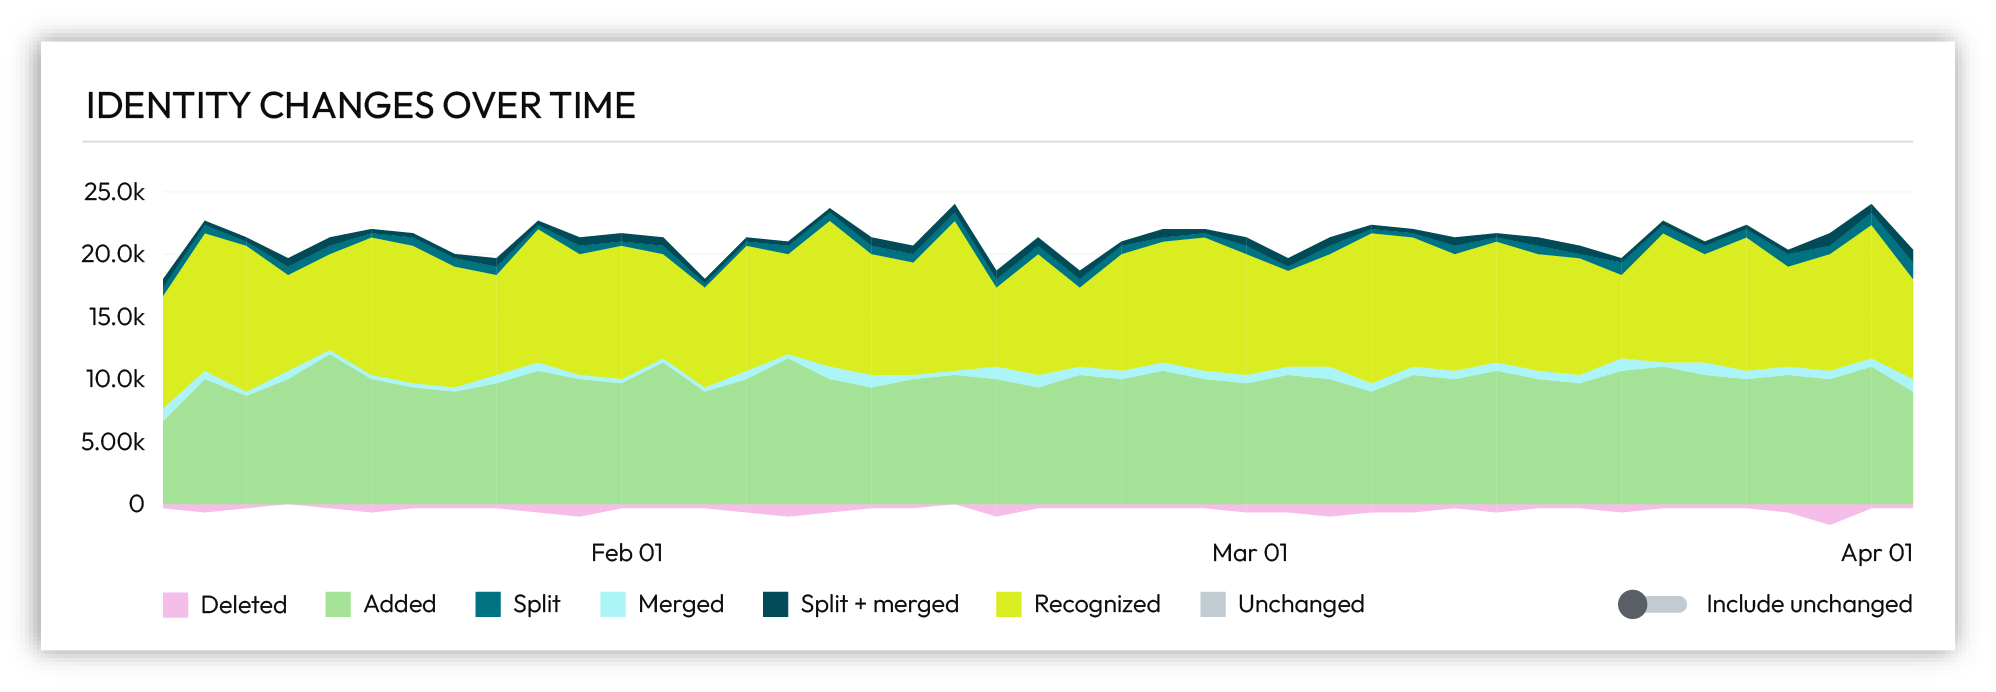
Changes, such as Added, Merged, or Recognized, are tracked for each identity graph over a 90-day time period.
Action |
Description |
|---|---|
Added |
A new Amperity ID was created and added to an identity graph. This type of change occurs when new customer records are added to Amperity. |
Deleted |
An Amperity ID was deleted. This type of change occurs when records are removed from source data, such as after responding to a compliance processing request. |
Merged |
Amperity IDs assigned to two or more profiles in the previous identity graph were combined into a single customer profile and assigned to an Amperity ID that existed in the previous identity graph. This type of change occurs when data clarifies connections between accounts that were not previously known to be related. Stitch rules define criteria for when records are separated or clustered during identity resolution. |
Recognized |
Additional records were appended to a customer profile in an identity graph that was assigned an Amperity ID without a Merge, Split, or Split + Merge operation. This type of change occurs during real-time workflows. Identity recognition relies only on whatever is known about a customer at an exact moment to try to associate that information to a known customer profile. Sometimes what is known is an app or website login that uses an email address or a phone number. Sometimes what is known is a durable identifier, such as a loyalty account ID. Sometimes what is known is a machine-issued digital identifier for Google Ads ID, a mobile device ID, or an advertising-related temporal identifier, such as a pixel ID. |
Split |
Am Amperity ID assigned to a customer profile from the previous identity graph was split into two or more new customer profiles. New Amperity IDs were assigned to the new customer profiles. This type of change occurs when new data clarifies ownership of a shared source identifier, such as a device ID, email address, or phone number. Stitch rules define criteria for when records are separated or clustered during identity resolution. |
Split + merged |
Multiple Amperity IDs from the previous identity graph were split from existing profiles, and then merged into new customer profiles and assigned new Amperity IDs. This type of change occurs when new data provides clarity to sparse records. Stitch rules define criteria for when records are separated or clustered during identity resolution. |
Unchanged |
An Amperity ID did not change. |
Identity resolution analyzes source tables, extracts customer profiles and interactions, and then compares pairs of records using machine learning models to build an identity graph. Each record pair is scored and all records connected using deterministic, probabilistic, or transitive matches represent a unique customer profile.
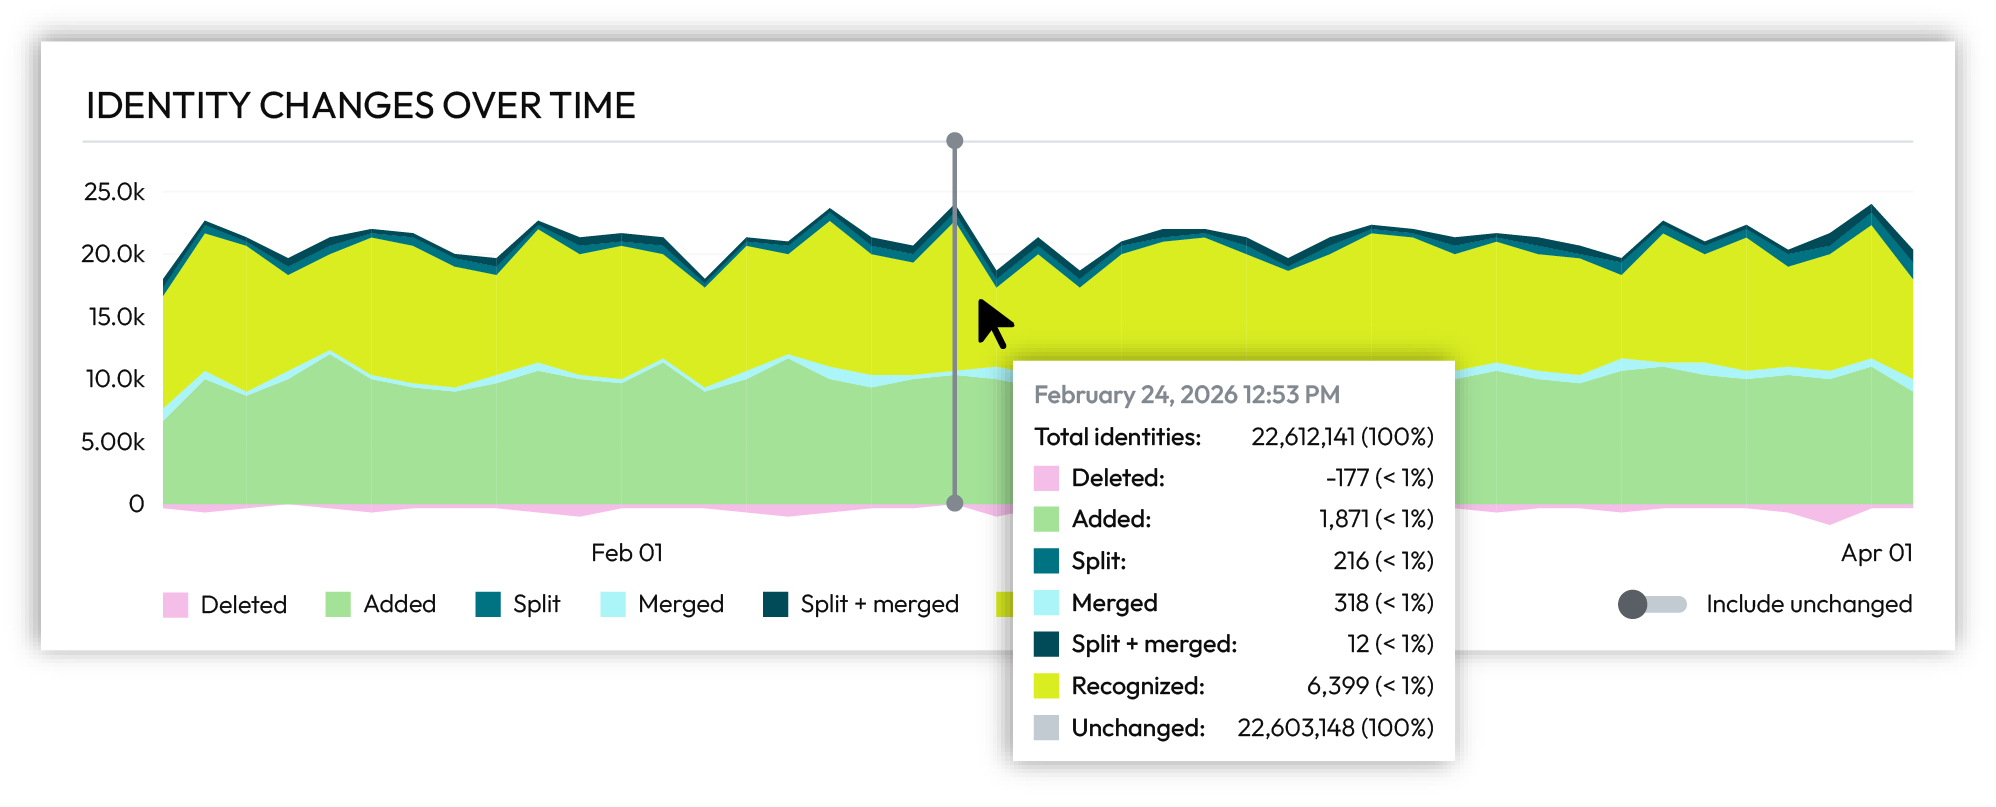
Hover over individual days in the chart to show identity changes for specific days.
Identity changes are a very small percentage of total customer profiles.
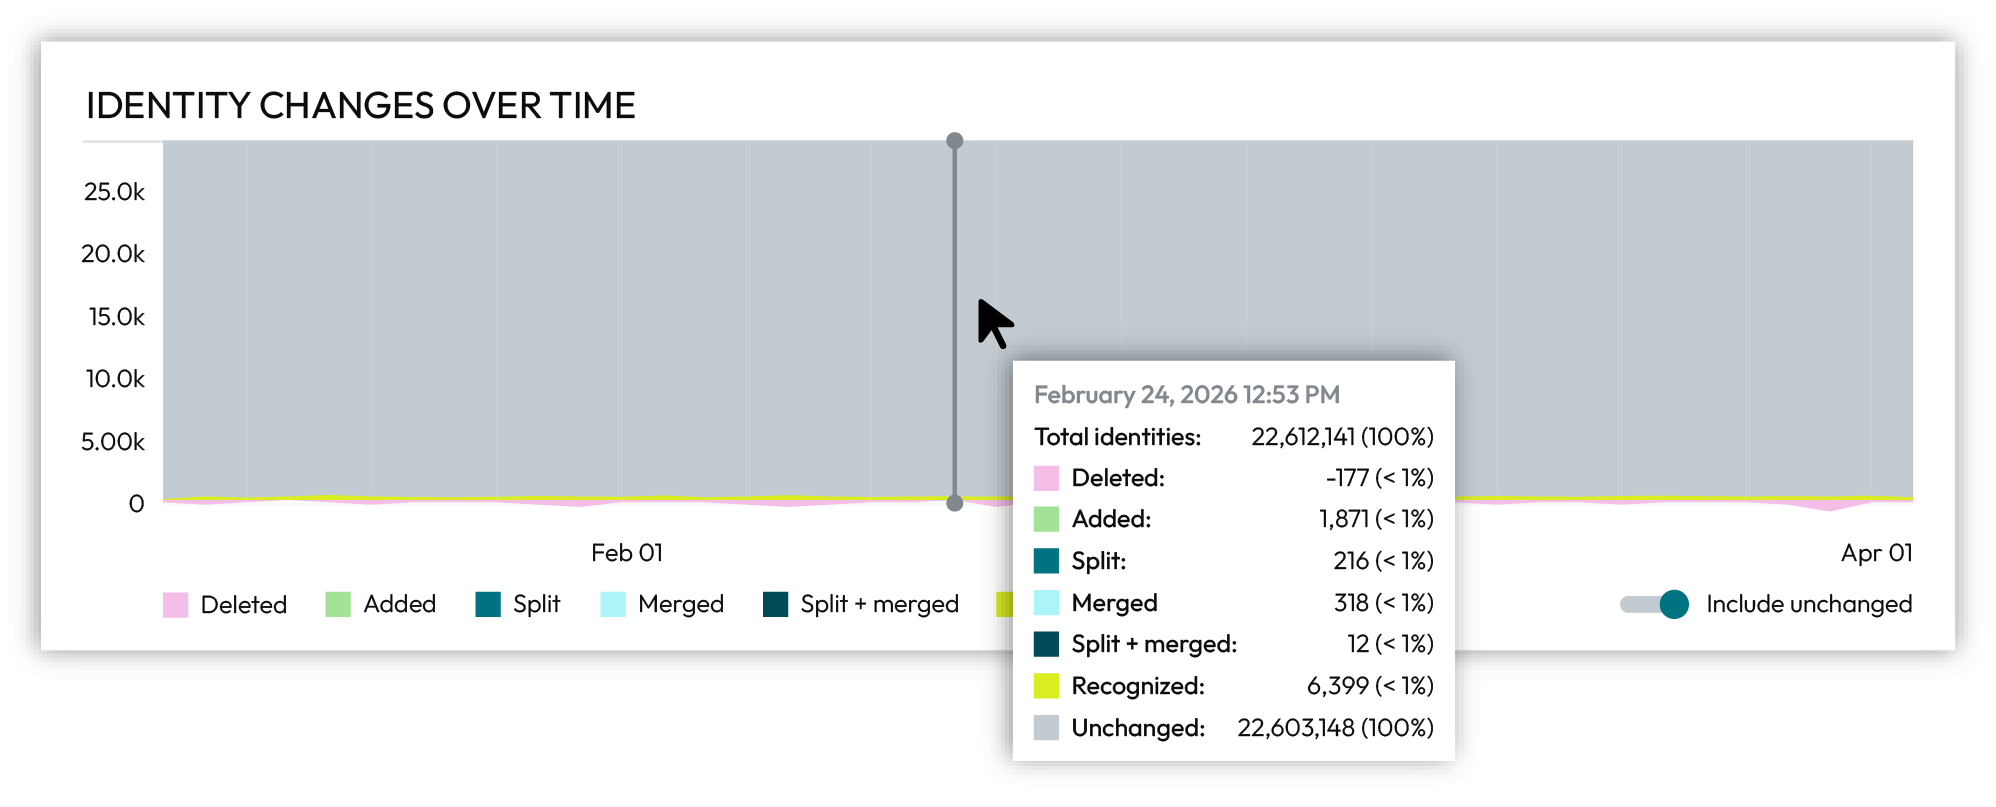
Enable the Include unchanged slider on the right side below the chart to view unchanged customer profiles. Unchanged customer profiles are shown in grey.
Matching strategies
An identity graph is the foundation for unified customer profiles. Each customer profile represents a unique customer. Records are connected using a combination of deterministic, probabilistic, and transitive matching. A keychain of identifiers links records in each profile back to source data.
An identity graph is built by comparing records, such as those with personally identifiable information (PII), transaction histories, shopping preferences, and loyalty account information, and clustering matching records into individual customer profiles. Each customer profile in an identity graph is assigned an Amperity ID.
Each identity graph is created from a combination of deterministic and probabilistic matching rules that define conditions for when records should be clustered or separated. The Rules Editor defines a heirarchy of deterministic and probabilistic matching strategies for each identity graph. Identity resolution attempts to match on a rule starting at the top of the list of rules in the rules heirarchy. The first rule that matches is scored.
Why does Amperity “try” to match records?
Amperity does not force record assignment to an identity.
Amperity uses deterministic and probabilistic matching strategies to define conditions that determine when records should or should not match. All record pairs are scored. The scores represent the strength or weakness of the relationship between two records.
Exact matches are assigned minimum or maximum scores.
Fuzzy matches are assigned similarity scores.
It may not be possible to satisfy all of the rules-based scoring conditions:
Default scoring model may assign a score
A transitive connection may be discovered
Edge analysis identifies records that should or should not cluster together
For example, it is possible for a customer profile within an identity graph to have more than one email address because other records within the customer profile scored high enough to match or additional email addresses were discovered transitively.
As the data your brand collects changes over time the data your brand makes available to Amperity changes. Amperity adapts and updates the identity graph to reflect the current state of your customer data.
The Summary tab, under Matching strategies, shows the percentage of total profiles in the identity graph that were discovered using deterministic, probabilistic, and transitive matching.
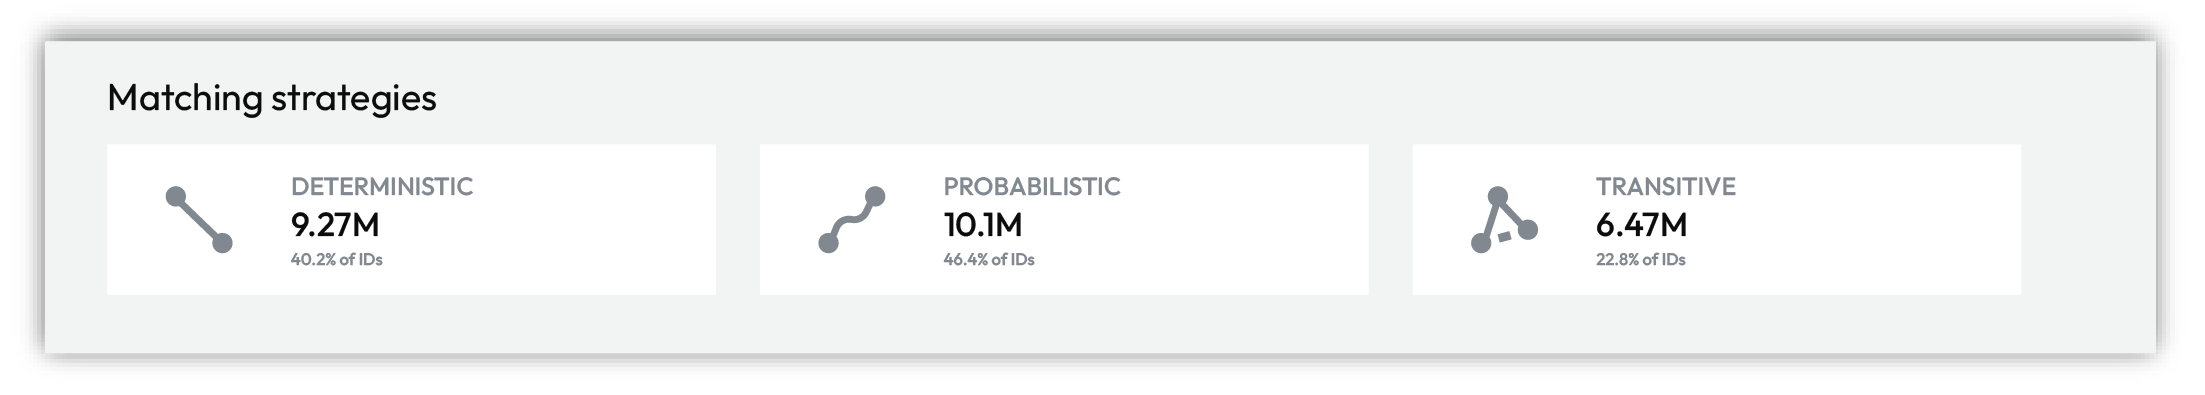
Identity graphs can be configured to be more deterministic or less deterministic. Most often an identity graph uses a combination of deterministic and probabilistic rules for identity resolution. In addition to deterministic matching and probabilistic matching, identity resolution discovers transitive connections that lead to more accurate and more complete customer profiles.
Deterministic matching
Deterministic record matching uses rules that define exact matching for customer keys and semantic tags. Records that do not match exactly to a rule are not scored.
Deterministic matching strategies try to cluster records together when conditions are met. For example, a deterministic strategy for loyalty IDs tries to match records with the same loyalty ID.
Probabilistic matching
Probabilistic record matching uses rules that define approximate matching for customer keys and semantic tags. Records that approximately match are evaluated by Stitch and scored.
Probabilistic matching strategies try to separate records when conditions are met. For example, a probabilistic strategy for email addresses tries to separate records with different email addresses.
Transitive matching
A transitive connection exists when any two records share a strong match to an intermediate record, but do not have a strong match to each other. For example: record 1 matches record 2, record 3 matches record 2, and records 1 and 3 do not match. A transitive connection exists between records 1 and 3 because both records match record 2.
Transitive connections are discovered during identity resolution.
About match categories
A match category is applied to individual record-pair comparisons discovered by deterministic and probabilistic matching strategies during identity resolution.
Match Category |
Description |
|---|---|
Exact |
Amperity has the highest confidence. Records represent the same person because all profile data exactly matches. |
Excellent |
Amperity has near perfect confidence that records belong to the same person, despite some profile data not matching. |
High |
Amperity has high confidence that records match, despite some profile data not matching. |
Moderate |
Amperity has moderate confidence that records match, due to weak or fuzzy matches between unique customer attributes, such as email, phone, or address. |
Weak |
Amperity lacks confidence, but if asked to guess, Amperity would assert these records do belong to the same individual, because they match on non-unique customer attributes, such as name, state, or ZIP code. |
Non-match |
Amperity has high confidence that these records do NOT match, because core profile data is in conflict. |
The score assigned to matched records is the match type. Possible values: “scored”, “scored_transitive”, and “trivial_duplicate”. Records assigned a “scored” value are directly connected by deterministic or probabilistic matching. Records assigned a “scored_transitive” value are transitively connected.
About scoring record pairs
Stitch uses the following scoring systems to determine how strongly two records are matched:
Rules-based scoring
Rules-based scoring relies on an ordered list of rules. Each rule defines a condition and an action to take when that condition is met. A condition is a set of criteria that determines if two records can match.
For example, rules for clustering records are similar to:
cluster records
  when values match for loyalty-id

cluster records
  when values approximately match for given-name
  and values approximately match for surname
and rules for separating records are similar to:
separate records
  when values differ for phone

separate records
  when values significantly differ for email
Identity resolution compares two records by starting at the top of the list of rules, and then stepping through the list of rules until a condition is met. When a condition is met the corresponding action is taken. Identity resolution stops comparing two records after the first action is taken, even if additional conditions could be met.
For example, two records with different names, addresses, and phone numbers. Both records have the exact same loyalty ID.
If the first rule with a matching condition is:
cluster records
  when values match for loyalty-id
both records cluster together because of the exact match on loyalty ID.
If the first rule with a matching condition is:
separate records
  when values differ for phone
and the second rule is:
cluster records
  when values match for loyalty-id
both records are separated because the phone numbers are different, even if the loyalty IDs are identical.
The order of rules for rules-based scoring is important and should be carefully considered to ensure the identity graph built from these rules matches the desired business use cases for the identity graph.
Every record that meets the conditiona for rules-based scoring is assigned a pairwise connection score.
A pairwise connection has a score with two parts separated by a period.
The first part–the record pair score–correlates to the match category, which is a machine learning classifier applied during identity resolution to individual record pairs:
5 for exact matches
4 for excellent matches
3 for high matches
2 for moderate matches
1 for weak matches
0 for non-matches
Identity resolution uses the second part–the record pair strength–to show the quality of the record pair score. This value appears in the Stitch report as a two decimal number. A record pair strength by itself is not a direct indicator of the quality of a pairwise connection score.
Tip
Review pairwise connection scoring for an identity graph from
THe Unified Scores table
The Pairwise connections tab in the Data Explorer
Default model scoring
Default model scoring is applied to all records that did not match a rules-based condition. Default model scoring has the following options:
Amperity AI
Stitch uses patented algorithms to process massive volumes of data and discovers the hidden connections in your customer profiles that identify unique individuals. Stitch analyzes customer data, applies the rules you define, and then builds an identity graph with accurate and actionable customer profiles. Each customer profile is assigned an Amperity ID.
Use Amperity AI model scoring to build an identity graph with deterministic and probabilistic matches, along with opportunities to discover transitive connections that lead to more accurate and more complete customer profiles.
A hybrid model–the most common approach–uses a mixture of exact matching and fuzzy matching with cluster and separation rules to precisely tune scoring for an identity graph. Records are matched deterministically and probabilistically. Transitive connections are discovered. The identity graph has accurate and complete customer profiles.
All records that did not meet the conditiona for rules-based scoring are assigned a pairwise connection score by the Amperity AI model.
No matching model
Records are matched only on clustering rules. All records unable to match on a clustering rule are not included in a cluster.
Use No matching model to build a purely deterministic identity graph that builds customer profiles when cluster rules match. Pairwise connection scores are assigned only to records matching on a cluster rule during rules-based scoring.
Identity complexity
Each identity graph is a combination of deterministic, probabilistic, and transitive connections. As the data your brand collects changes the data your brand makes available to Amperity changes. Amperity adapts and updates the customer profiles and keychains within in the identity graph to relect the current state of your customer data.
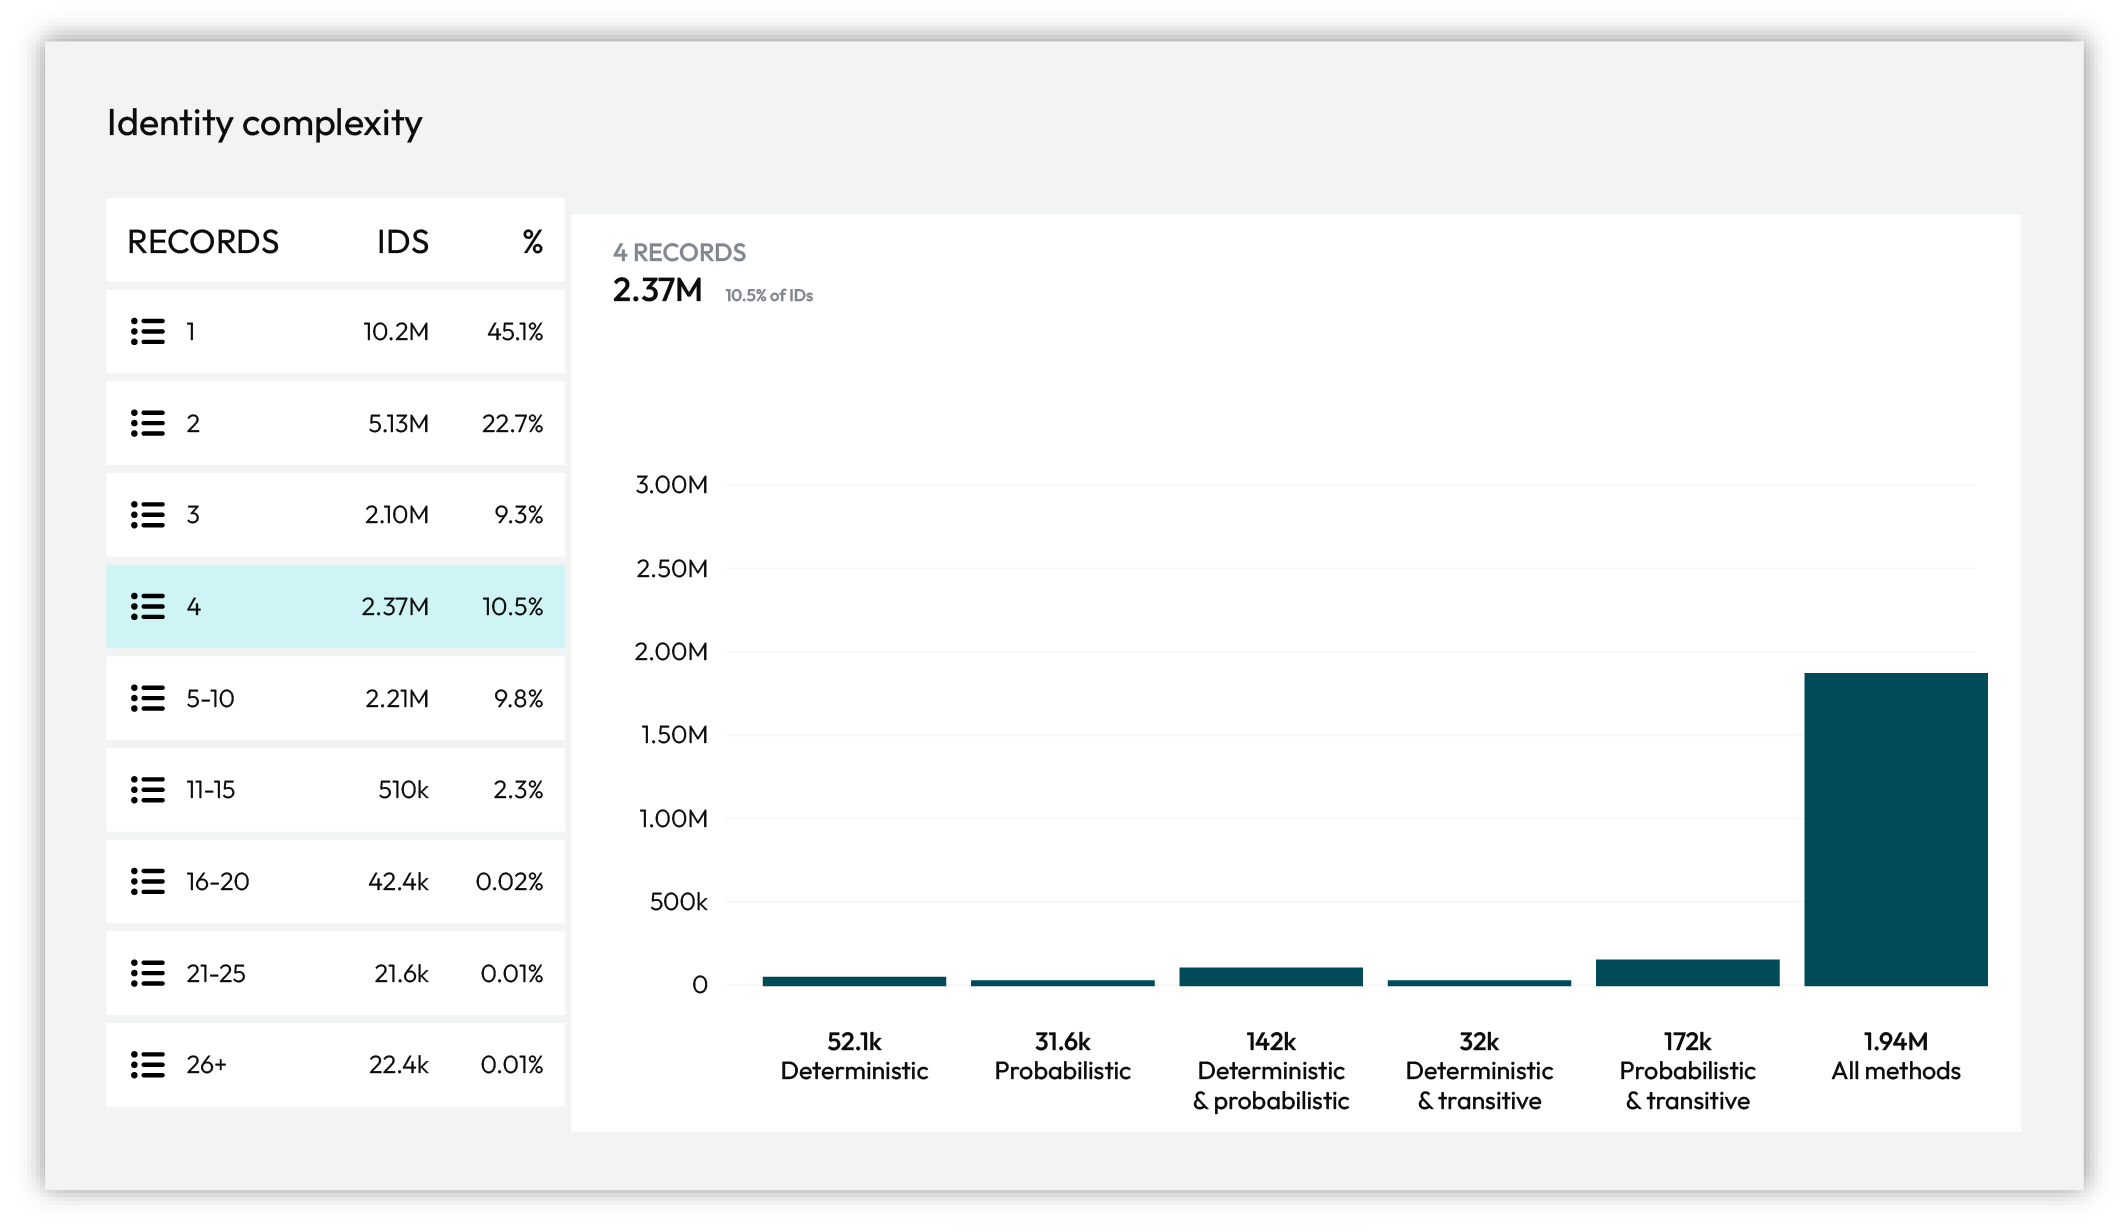
The chart under Identity complexity breaks down cluster size by the types of matches found within the clusters.
Action |
Description |
|---|---|
Deterministic only |
Customer profiles built using only deterministic matching. |
Probabilistic only |
Customer profiles built using only probabilistic matching. |
Deterministic and probabilistic |
Customer profiles built using a combination of deterministic and probabilistic matching. |
Deterministic and transitive |
Customer profiles built using a combination of deterministic and transitive matching. |
Probabilistic and transitive |
Customer profiles built using a combination of probabilistic and transitive matching. |
All strategies |
Customer profiles built using a combination of deterministic, probabilistic, and transitive matching |
About benchmarks
Stitch benchmarks are heuristic scores that define the expectations for the quality of customer profiles that are output by Stitch. Each benchmark evaluates your brand’s data and compares it to a baseline score.
Use benchmarks to explore data quality, directly provide feedback to the quality of Stitch results, and to explore configuration changes that can help improve the quality of customer profiles in your tenant.
Note
Stitch benchmarks are unavailable with incremental matching.
Benchmark status page
Stitch benchmarks are available from the Stitch page in your Amperity tenant. Open the Benchmarks tab to review the overall status for Stitch benchmark checks in your tenant.
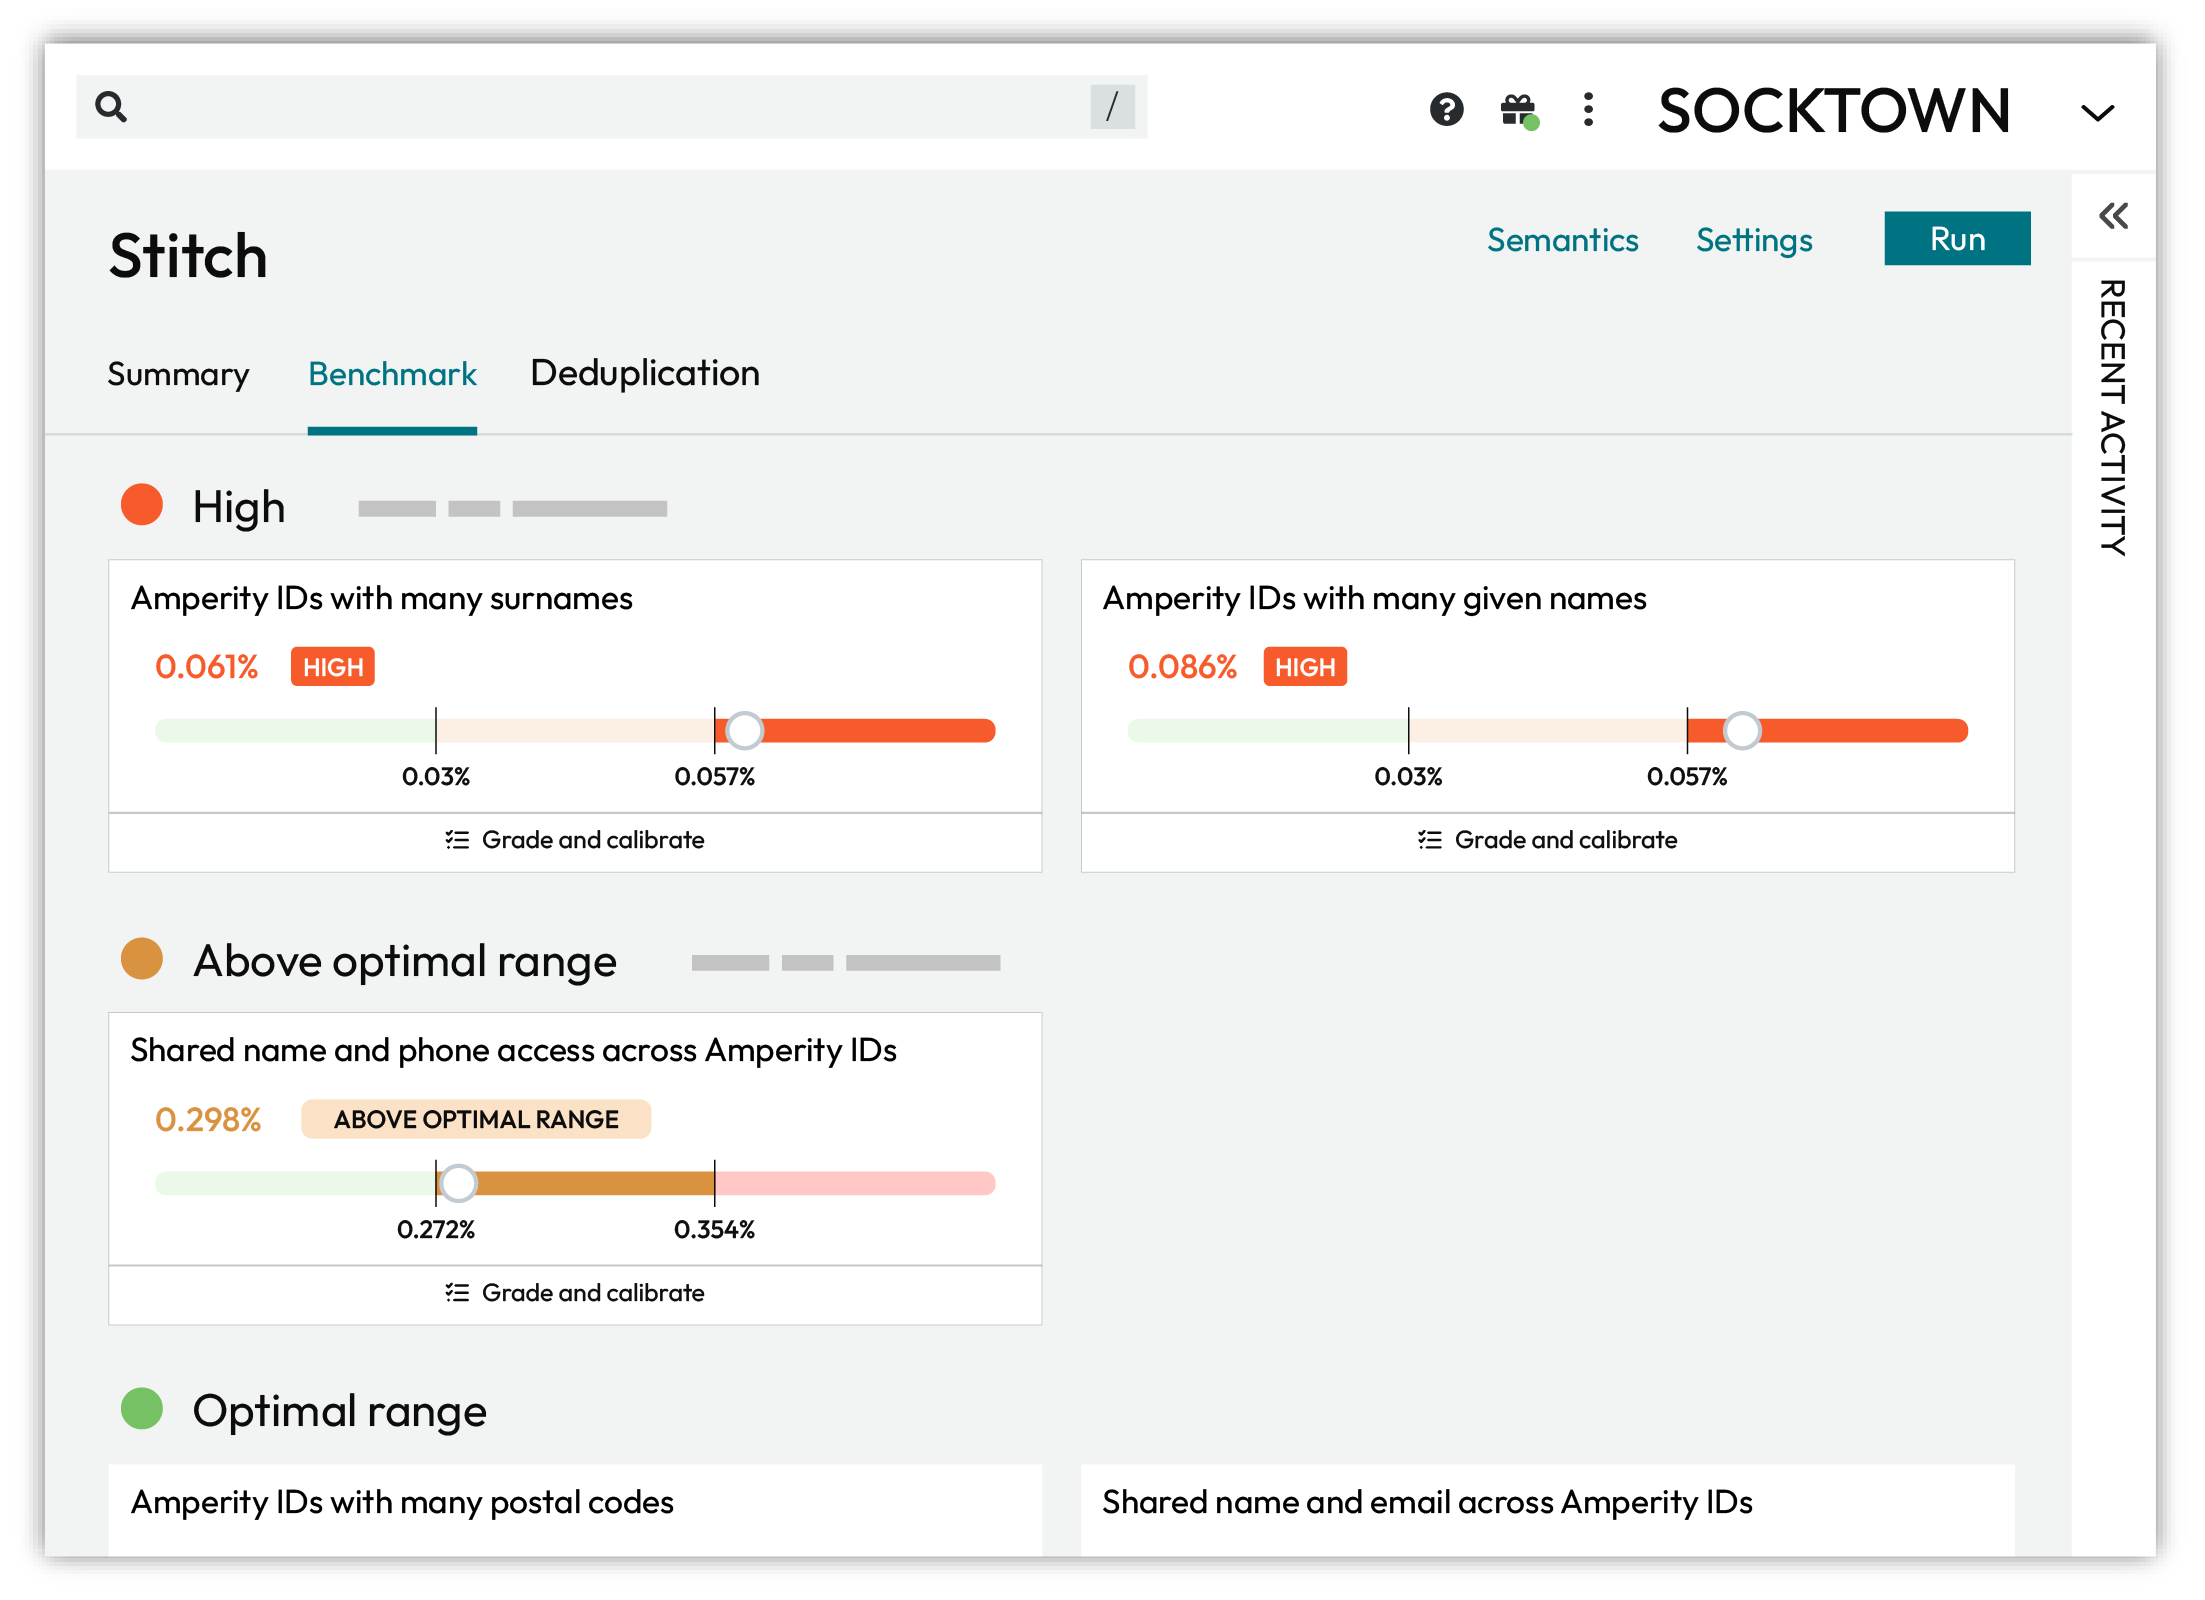
The outcome of Stitch benchmark checks are grouped by color on the Benchmarks tab.
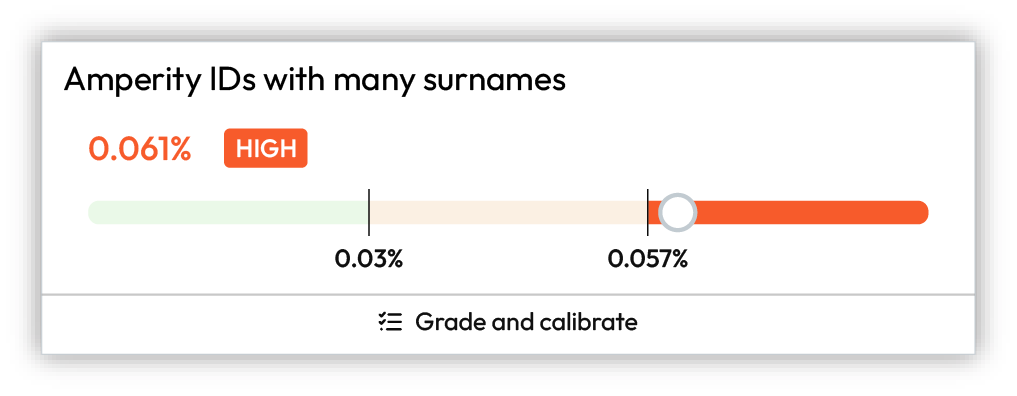
Red indicates that results are high.
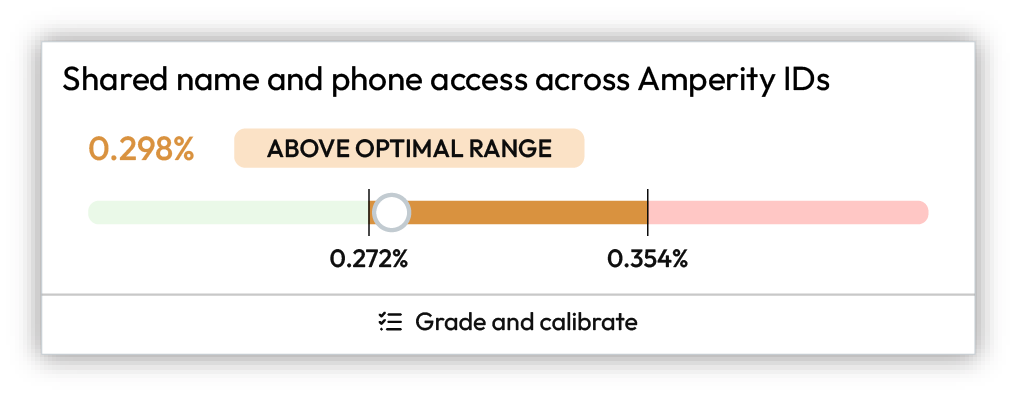
Orange indicates that results are above the optimal range.
Green indicates that results fall within the optimal range.
For each benchmark check on the Benchmarks tab you can click to open the benchmark, and explore details, the previous five benchmark scores, interpretations, and a link to open a dialog box from which you can review and grade a representative sample of 10 examples.
Benchmark checks
Stitch collects data that your brand has provided to Amperity, runs, and then outputs a series of tables that contain the results.
A “ground truth” dataset for your brand, against which Amperity can compare Amperity IDs to validate identity, does not exist and prevents using standard error metrics to evaluate the quality of Stitch output.
A benchmark check is a heuristic that defines how often Amperity IDs are expected to meet a certain condition. For example, Amperity expects no more than 0.011% of your Amperity IDs to be associated with more than three given names.
Each benchmark check measures the percentage of Amperity IDs meeting its respective condition and compares the result against the optimal range. A benchmark check result can fall into the optimal range, above the optimal range, or far above the optimal range (high).
For example, it is expected that most, but not all, Amperity IDs should not have more than three given names. It is possible for an Amperity ID to be correctly associated with more than three given names for valid reasons such as differences in data capture, the presence of typos, use of nicknames, or name changes. A higher-than-expected rate of Amperity IDs associated with more than three given names may be an indicator that Stitch is clustering records together too aggressively.
Important
Stitch is complex and perfection of Stitch results should not be the goal. A benchmark score that falls outside of an optimal range might not be a bad score. A high benchmark score does not always need to be addressed, at least not right away.
The purpose of benchmark scores is to provide a visible and direct way of inspecting the quality of customer profiles that exist in your tenant.
Use benchmark scores to:
Assess the overall quality of customer profiles in your tenant.
Explore example Amperity IDs, especially for those benchmark checks that are high, to identify ways of changing the configuration of your tenant that can lead to overall improvements in benchmark scores.
Use a sandbox to test configuration changes. Compare the scores in the sandbox to the scores in production.
Improve your understanding of how Stitch builds customer profiles based on the data sources that your brand has provided to Amperity.
Identify specific areas of improvement, such as updating semantic tags in feeds or custom domain tables, changing the set of domain tables that are made available to Stitch, or identifying a foreign key or separation key that is causing issues with cluster quality.
Look for themes and address them. For example, if a benchmark check shows 7 out of 10 examples all being wrong in the same way, that is a strong indicator that a configuration change should improve cluster quality. If all 10 examples are different you can mark them as edge cases and move on.
Think about the big picture: the overwhelming percentage of customer profiles are accurate. Benchmark checks look at the edges of that accuracy and give you ways to extend that accuracy to a small percentage of profiles.
For example, if you find obvious mistakes with the Amperity IDs with many given names benchmark check, but the results are optimal, then any changes to that benchmark are likely to have a very small affect on overall cluster quality, even if some individual profiles are incorrect.
Benchmark results
Amperity uses benchmark checks to provide insight into the quality of your Stitch results. Results fall into one of the following categories:
Optimal
Optimal results represent benchmark check results that fall within the expected range. These results can be “more optimal” and they can be “less optimal”.
For most tenants, most of the time, nothing needs to be done when benchmark checks are optimal. In some cases, it might be worth exploring if scores that fall on the edge of optimal scoring and are close to falling outside the optimal range can be improved.
Above optimal range
Results that fall above the optimal ranges may be investigated, but it is often not necessary. Compare the history of the scores and determine if anything should be done to try to improve the benchmark results.
Was new data made available to your tenant? Were any changes made to Stitch configuration? Both of these may be the cause of scores falling above the optimal range.
In many cases nothing needs to be done with benchmark checks that fall above the optimal range beyond monitoring the result to see if it continues to increase or if it stabilizes.
High
High results do not need to be fixed, but they should be investigated. In many cases, high results indicate that improvements to the quality of Stitch results can be made.
Review and grade the results for benchmark checks with high results by assigning thumbs up or thumbs down to the sample set of records, after which you should click Show recommendations, and then review the list of options that are available to help improve this particular benchmark result.
Important
Use a sandbox to make configuration changes to Stitch, and then compare the benchmark results in the sandbox to the high benchmark results in production. Also compare other benchmark results to determine if changes affected the overall quality of benchmark results.
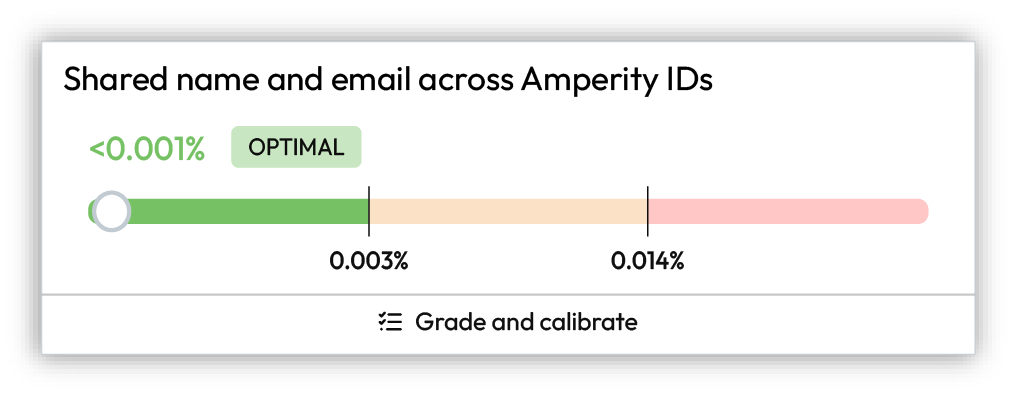
About benchmark cards
Each benchmark card has a condition summary, such as Amperity IDs with many given names, result (“0.125%”), outcome (Optimal, Above optimal, or High), along with a visualization that shows how the benchmark result compares to the optimal range.
Benchmark details
Benchmark details show specific information about the condition, such as The percentage of Amperity ID clusters with more than 3 given names, a visualization that shows the result in the context of the optimal range, a toggle to show or hide historical results, tips about how to interpret the results, along with any recommended next steps.
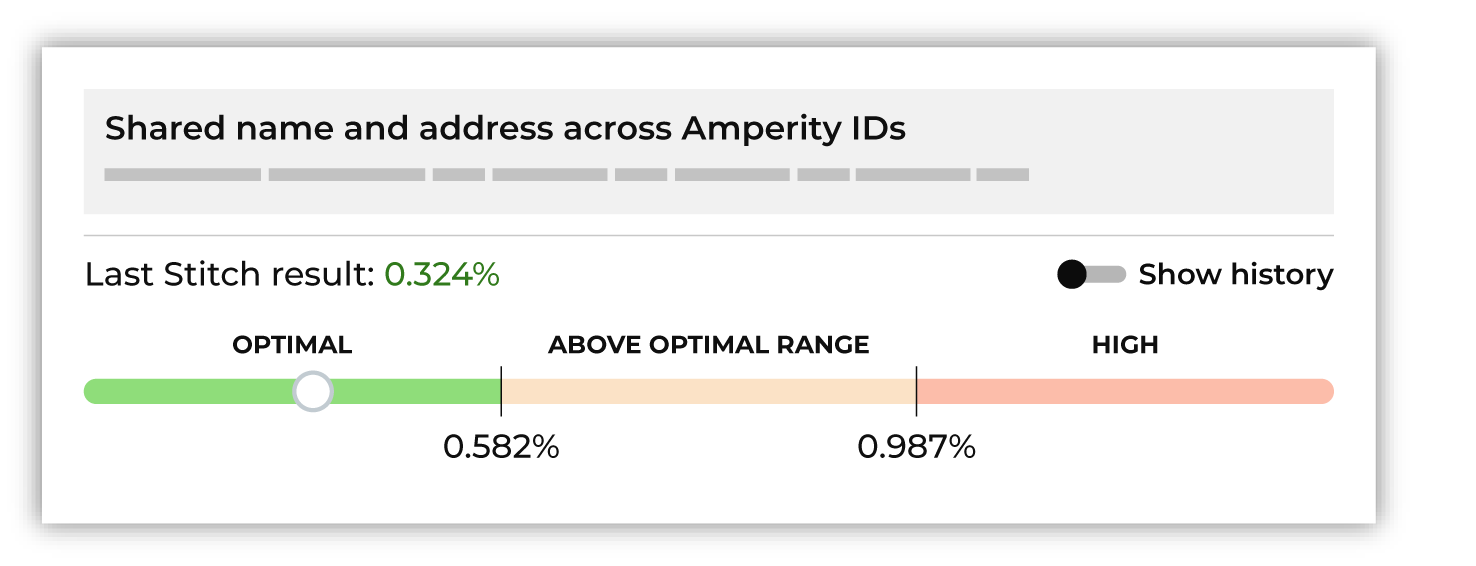
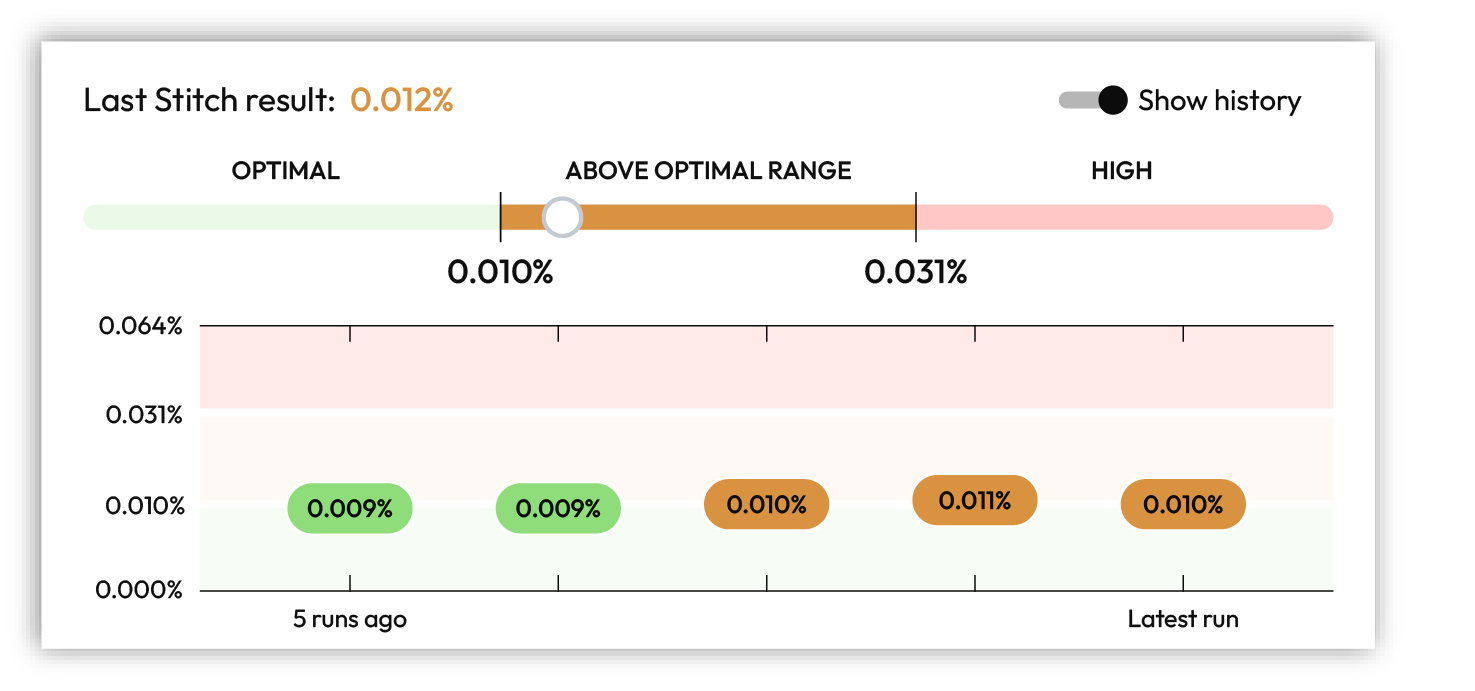
History
Benchmark results are refreshed after every Stitch run. You can view the 5 previous benchmark results by enabling the Show history option in the benchmark details dialog.
Interpretations
Interpretations are provided by each benchmark check. They describe the result and provide an explanation of how to interpret it. For example:
“This is above the expected range and may be an indication of overclustering. A large percentage indicates that different given names are appearing the same cluster, which indicates overclustering.”
or:
“This is far above the expected range and may be an indication of overclustering. A large percentage indicates that different postal codes are appearing the same cluster, which indicates overclustering.”
When a benchmark score is above the optimal range or high it is recommended to review and grade a set of 10 example clusters, after which the benchmark check will make a series of recommendations that can lead to improved benchmark results.
Grade and calibrate
All benchmark checks include example Amperity IDs that can be reviewed and graded. You should periodically review and grade examples for benchmark checks with high results. This helps ensure that Stitch is always building the highest quality customer profiles and can lead to incremental improvements over time.
Depending on the outcome of reviewing and grading benchmark check examples, a series of recommendations may be shown. Stitch configuration settings can be updated directly in the benchmark check.
The Grade and calibrate button shows your progress as a counter, for example (3/10), while you work through the 10 examples. When you have reviewed enough examples, the button changes to Show recommendations.
How does Amperity choose which records are available for grading?
Amperity uses stratified random sampling to select the examples. A fresh set of examples is generated during each Stitch run.
All clusters (or groups of clusters) that are flagged by the check are collected.
For example, with the Amperity IDs with many surnames check, all clusters with more than 3 surnames are collected.
A rules-based approach is used to determine which of these clusters are likely to be “good” identity decisions and which are likely to be “poor” identity decisions.
The percentage of clusters that are likely to be “good” identity decisions and the percentage likely to be “poor” identity decisions are identified.
For example: 70% good, 30% poor.
10 examples are selected at random using the same rate of “good” and “poor” clusters.
For example, 7 records will represent “good” identity decisions and 3 records will represent “poor”.
Amperity will make a recommendation for when to rate each example as “good”, but cannot identify without input which examples in the random sample represent “good” or “poor” identity decisions.
Update Stitch configuration
Depending on the outcome of reviewing benchmark check results and examples, a series of recommendations may be shown. Each recommendation represents a change that you can make to Stitch configuration that should lead to improvements in benchmark results.
Changes should be made incrementally. You can review benchmark checks on a daily basis. Review the results, and then make additional incremental changes, if necessary. Monitor the benchmark results after a configuration change for signs of improvement.
Benchmark categories
The following sections list benchmark checks by category:
Overclustering
An overcluster–a false positive–occurs when distinct records are incorrectly added to a cluster of records. Each overcluster affects the precision of identity resolution. Investigate to understand why they occur.
Stitch benchmark checks for overclustering evaluate situations where records that likely belong to two or more individuals end up being assigned the same Amperity ID. This can occur when records with different personally identifiable information (PII) are connected by a foreign key or by a small set of matching PII.
Many given names
The Amperity IDs with many given names benchmark computes the percentage of Amperity IDs with more than three given names.
A larger percentage implies that too many given names are being associated with the same Amperity ID at a higher-than-expected frequency.
Many postal codes
The Amperity IDs with many postal codes benchmark computes the percentage of Amperity IDs with more than five postal codes.
A larger percentage implies that too many postal codes are being associated with the same Amperity ID at a higher-than-expected frequency.
Many surnames
The Amperity IDs with many surnames benchmark computes the percentage of Amperity IDs with more than three surnames.
A larger percentage implies that too many surnames are being associated with the same Amperity ID at a higher-than-expected frequency.
Underclustering
An undercluster–a false negative–occurs when distinct records are incorrectly split from a cluster of records. Each undercluster affects the precision of identity resolution. Investigate to understand why they occur.
Stitch benchmark checks for underclustering evaluate situations where records that likely belong to the same individual end up being assigned different Amperity IDs. This can occur when records with similar personally identifiable information (PII) are separated by a separation key or by a small set of mis-matching PII.
About deduplication
The Deduplication tab shows a high-level set of statistics about the current state of identity resolution with links to exploring each area in more detail.
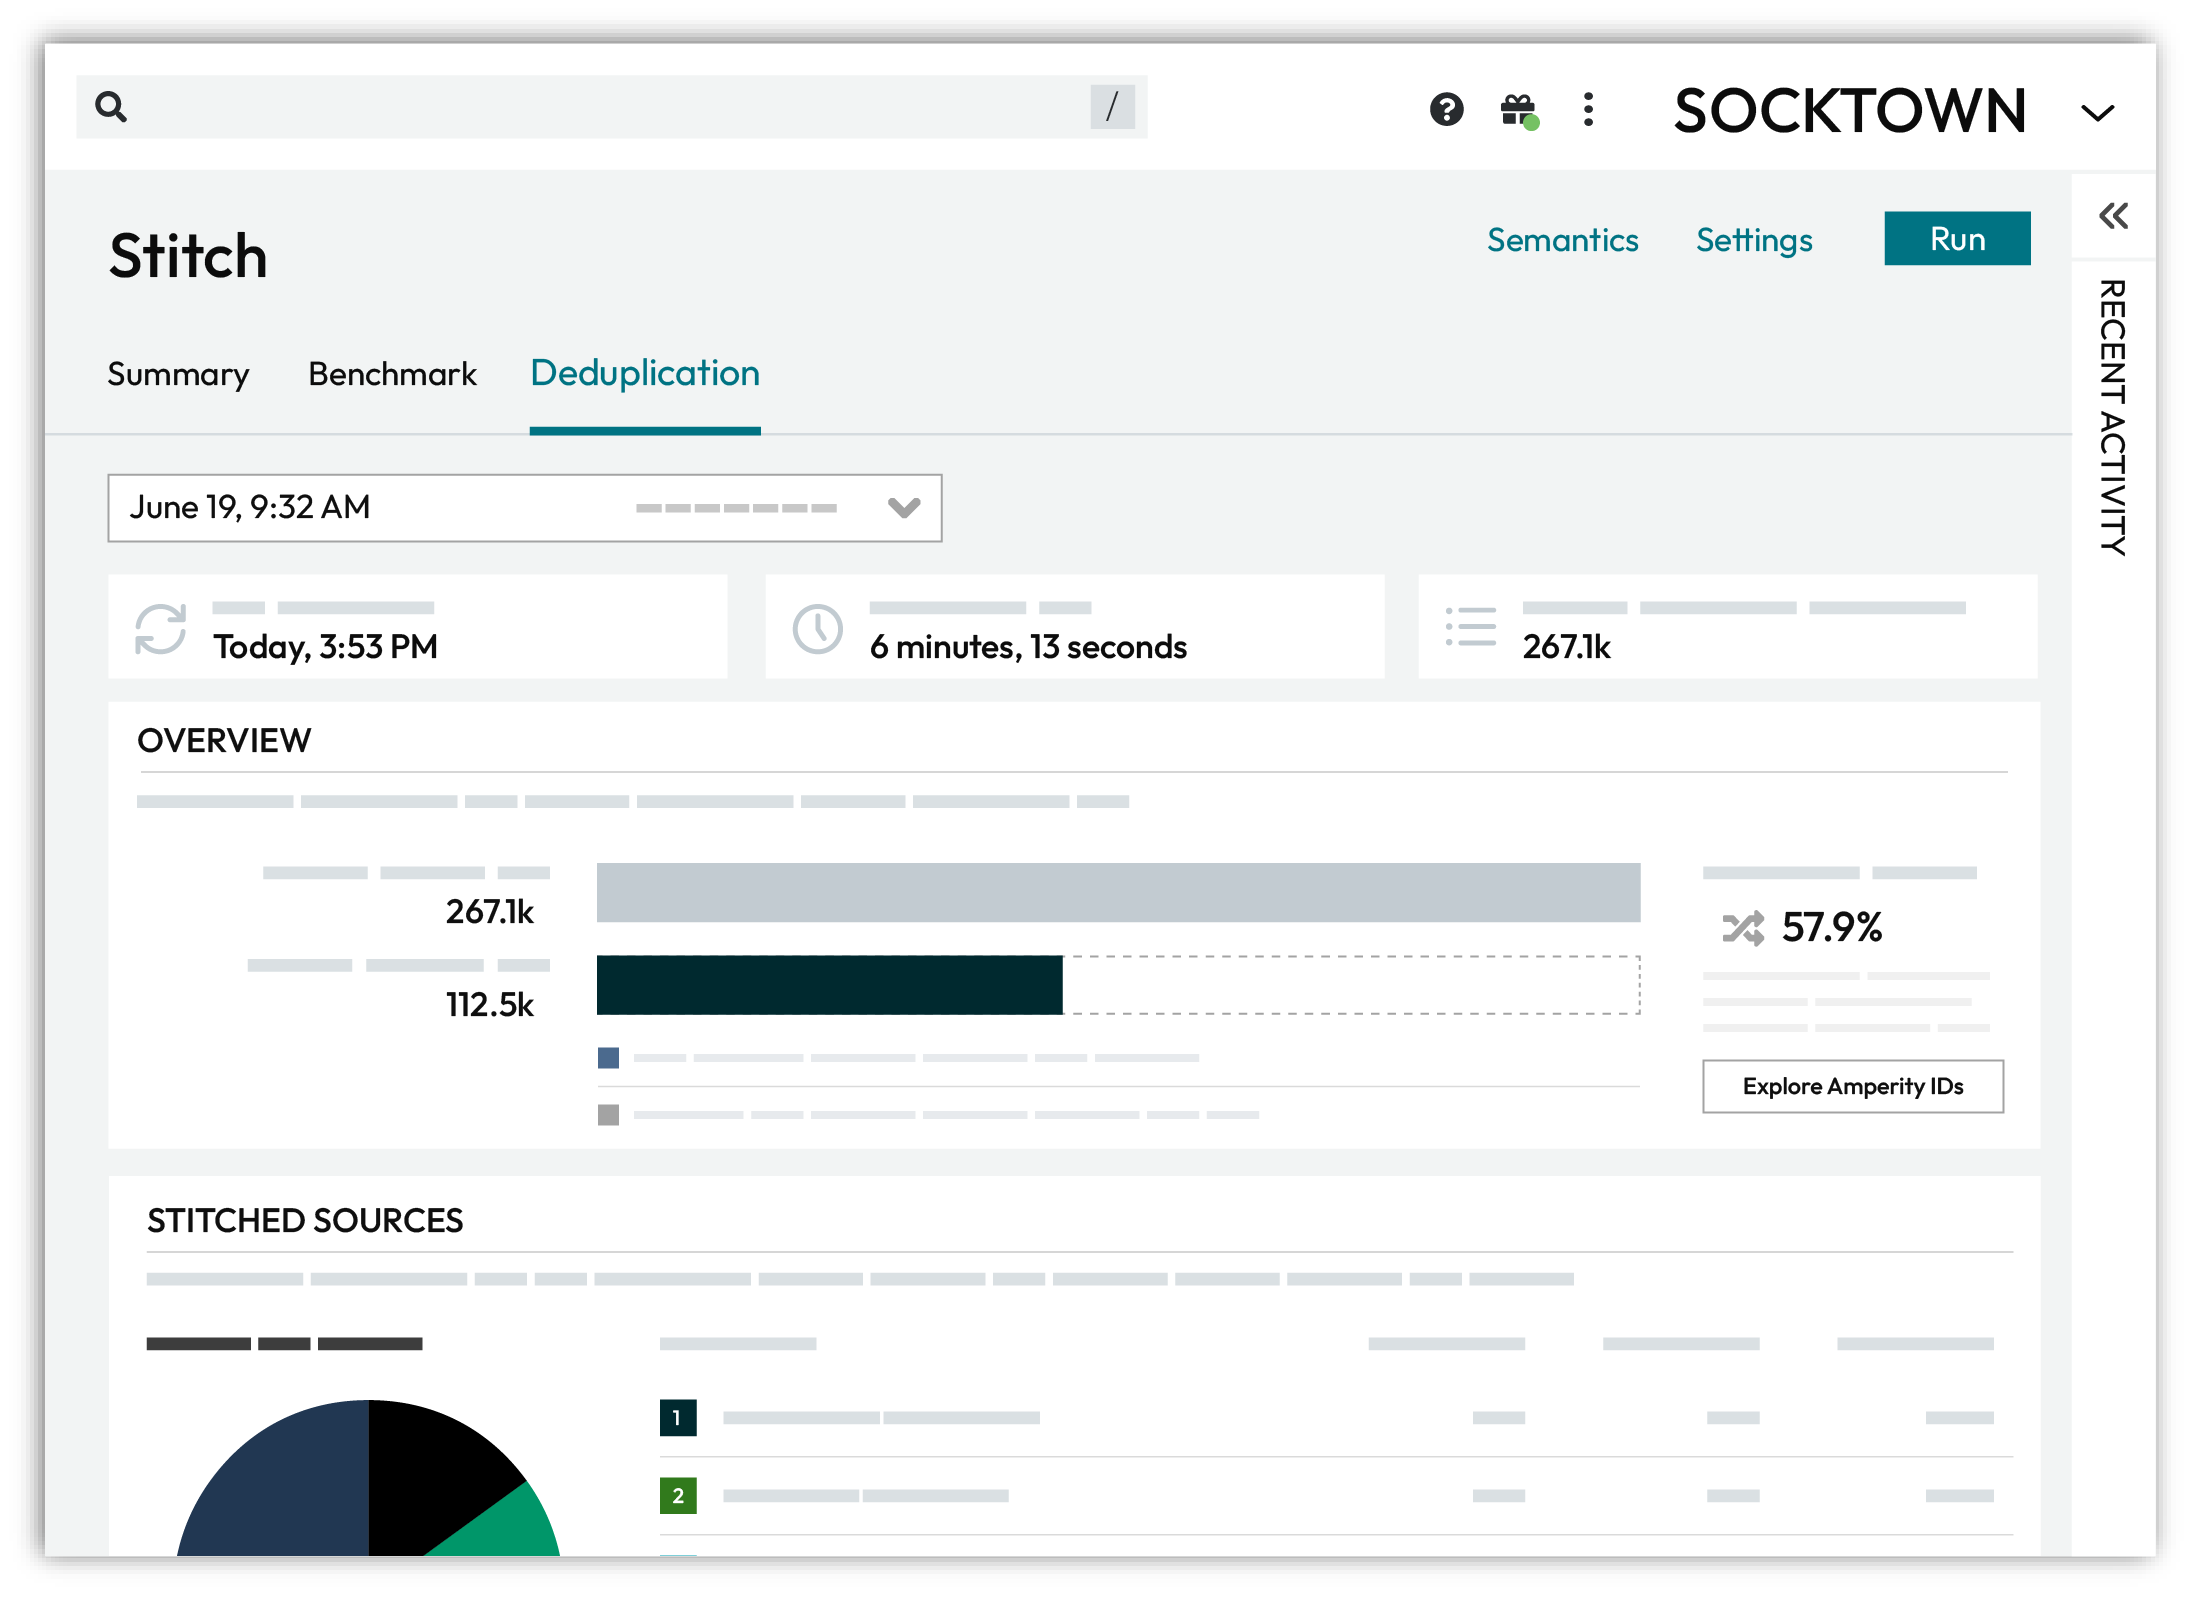
Open the Data Explorer to view Cluster graphs, pairwise connections, and individual customer profiles created by identity resolution.
Compare data sources and the rate of deduplication across sources.
Data Explorer
An Amperity ID is a unique identifier assigned to a cluster of records within an identity graph. Each Amperity ID represents all of the records within a customer profile.
As new data is input to Amperity, identity resolution identifies when new or changed data applies to existing clusters of customer records, and then updates those records, maintains the cluster, and retaining a stable Amperity ID assignment. A new Amperity ID is only created when new individuals are identified.
Note
The Amperity ID is a universally unique identifier (UUID) that is 36 characters spread across five groups separated by hyphens: 8-4-4-4-12.
For example:
123e4567-e89b-12d3-a456-426614174000
Amperity IDs do not replace primary and foreign keys already assigned in customer data. Amperity IDs exist alongside primary and foreign keys within the customer 360 profile and act as key for finding clusters of unique customer records.
To explore data
From the Stitch tab, click the Explore Amperity IDs button.
This opens the Data Explorer to the Stitched Records tab.
Use the left and right arrows surrounding the full name to view additional records.
Click through each record and each tab. When finished exploring, click Close.
Explore by data source
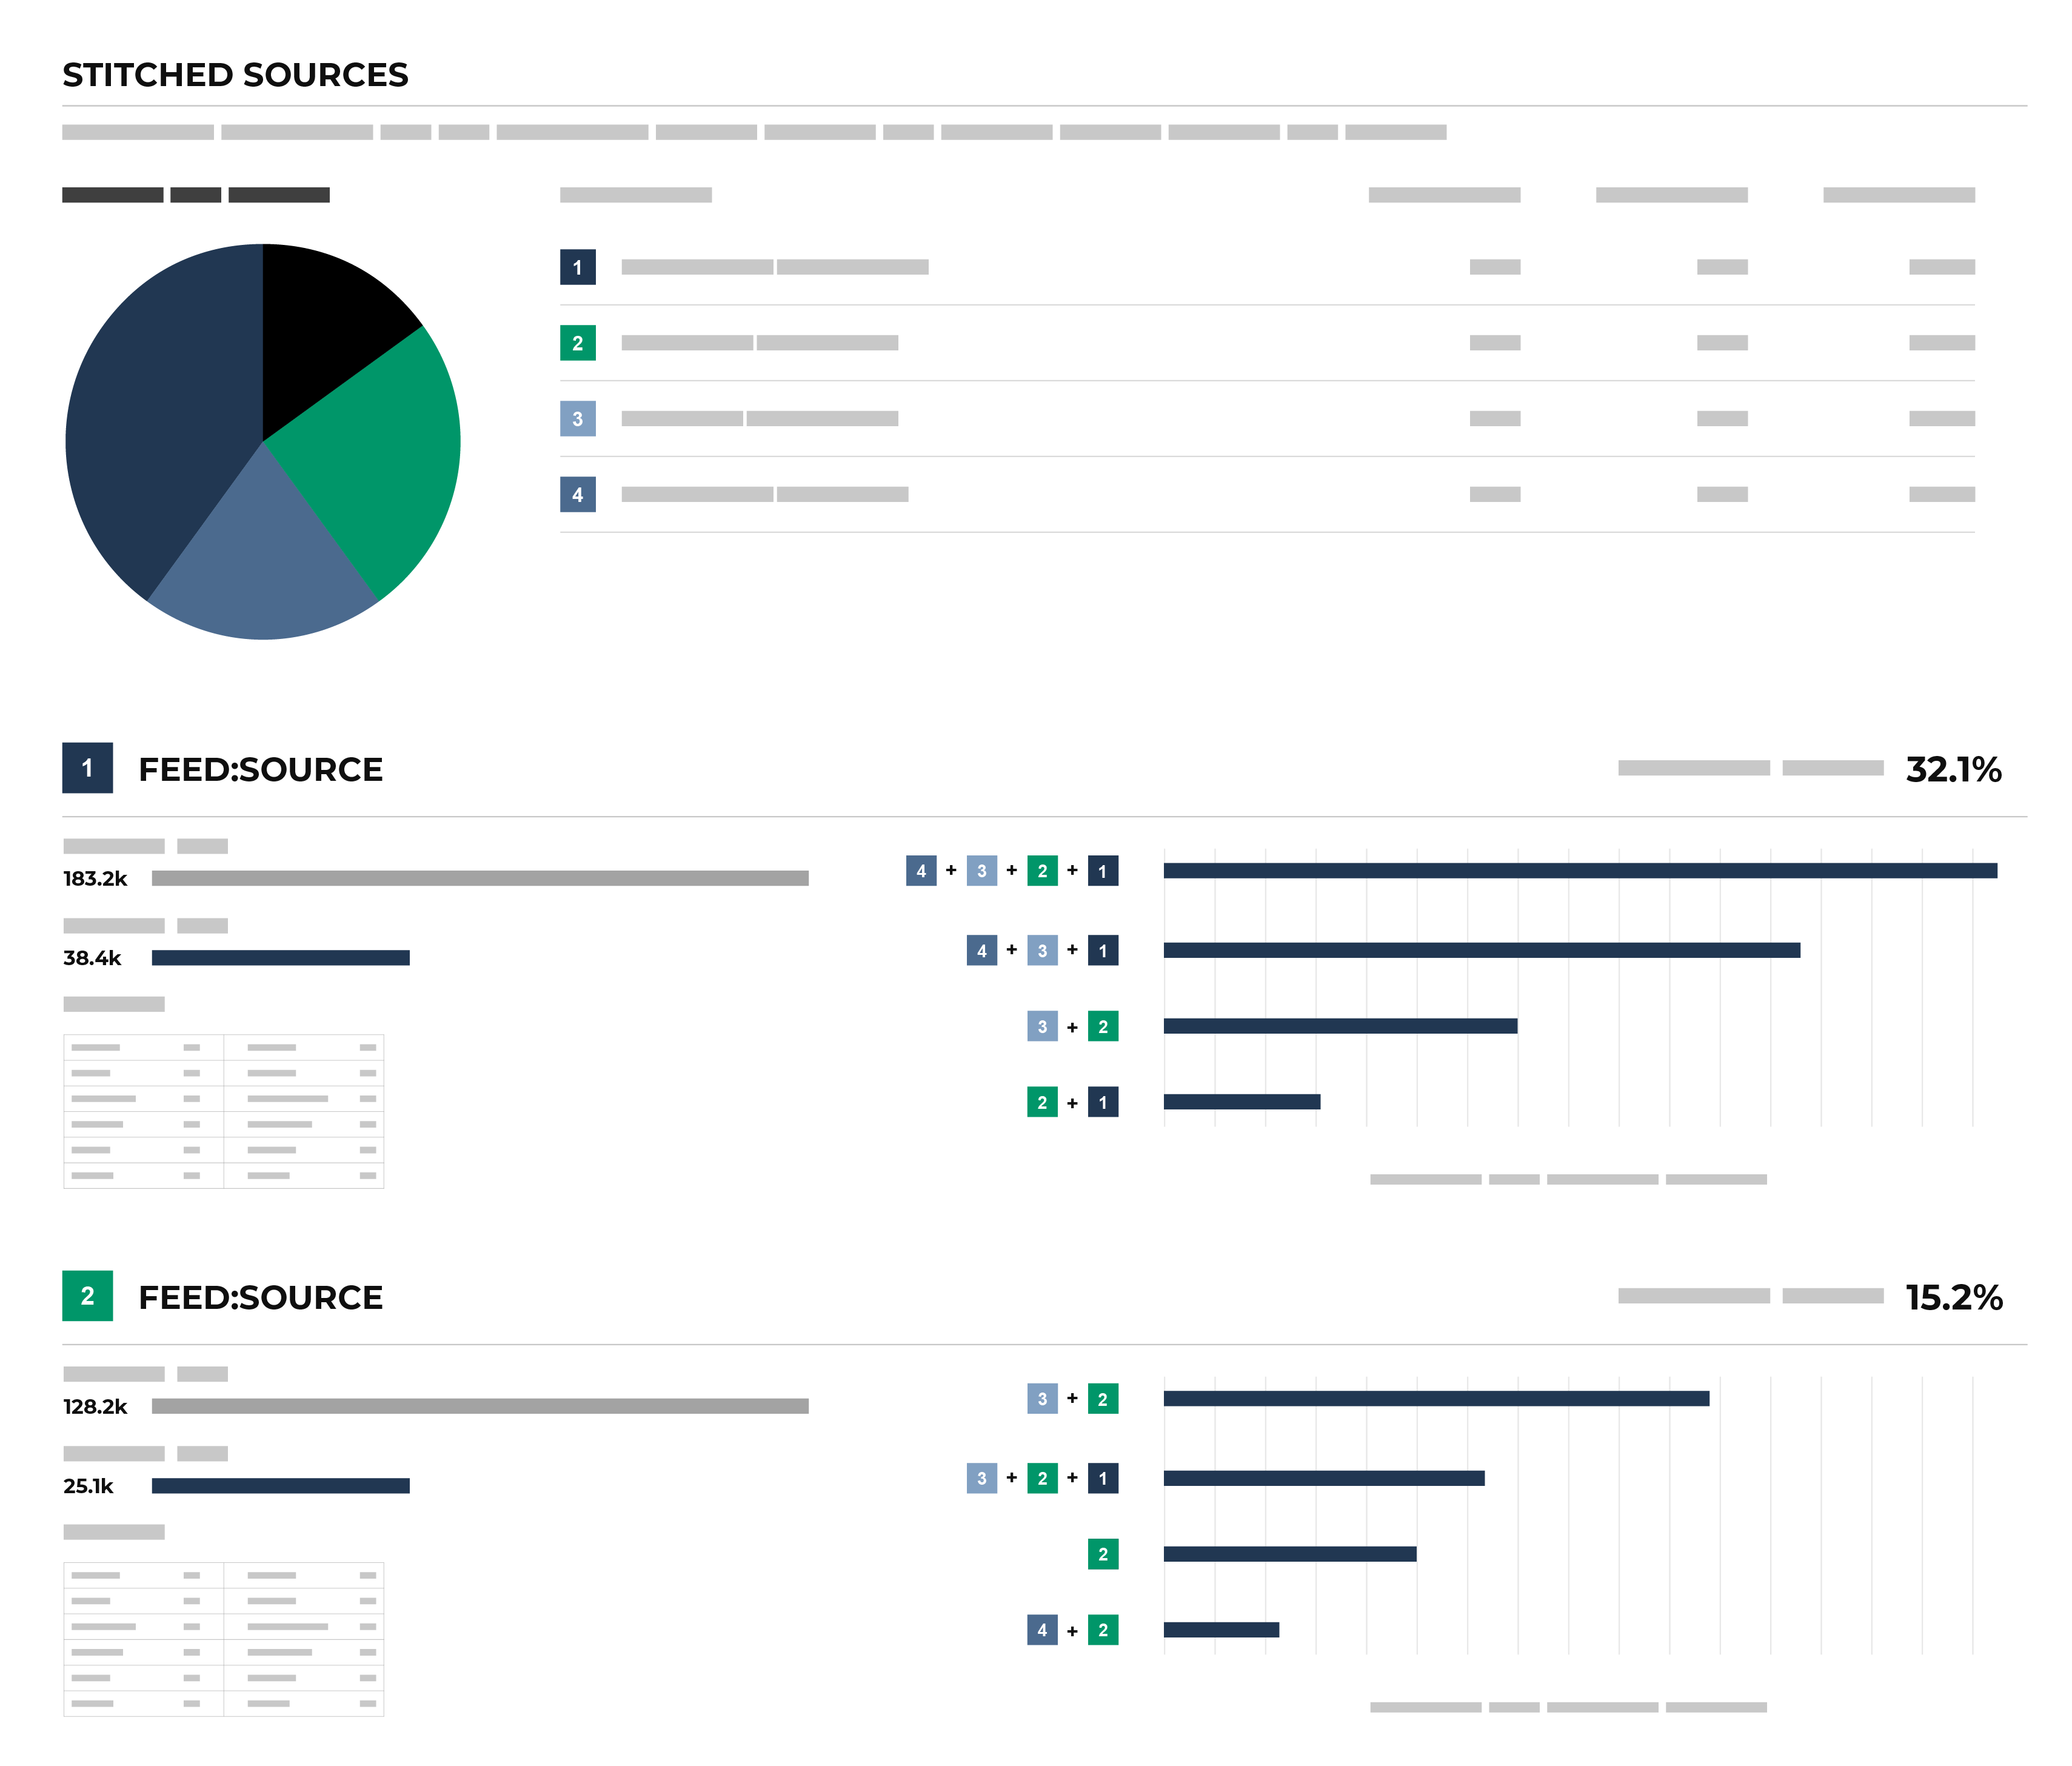
The Stitched Sources section of the Stitch page shows a comparison of domain tables and the record pairs identified both within each data source and across all data sources. This is presented as an UpSet Plot chart with links to the underlying data sources via the Data Explorer.
The following diagram shows the components of the UpSet plot chart, inclusive of the distribution of Amperity IDs across all data sources, and then for each data source, an individual breakdown of how that data source compares to all other data sources. An UpSet plot chart have a row for each data source. This diagram shows the first two only.
Each individual stitched data source can be explored from the UpSet plot. The UpSet plot includes a source-by-source breakdown of stitched data. For each record, a View source link is available. This opens the Data Explorer and displays a Schema for the data source that shows the name of the field as it is defined in customer data, the data type, the Amperity semantic applied to the field, and sample data. A Sample shows 100 records from that data source, where each of the fields defined in the customer data source are presented as columns of data.
To explore by data source
From the Stitch tab, under Stitched Sources, review the UpSet plot chart.
Click the database table name for any database table in the Upset plot chart to view more information about that data source.
Click the View source link to open the Data Explorer for that table, in which you can review the schema and view sample data.
When finished exploring, click Close.
Explore previous Stitch results
You can explore previous Stitch results from the Stitch tab. From the Stitch tab, next to the Stitch page title, select a result from the dropdown menu to view the Stitch results for that Stitch run.
Explore semantics
A semantic is a way to apply a common understanding to individual points of data across data sources, even when data sources have different schemas, naming conventions, and levels of data quality.
The Semantics link at the top of the Stitch page opens a dialog box that lists the configured semantics made available to Stitch from domain tables. This list is broken down by domain table, and then by semantic. For each semantic, it lists the semantic, its data type, and the name of the field as defined in customer data.
To explore semantics
From the Stitch tab, click the Semantics link. This opens the Stitch Tools dialog box.
Each table that has stitched records is listed in the dialog box.
For each table, a list of semantic names, their types, and the fields to which they are associated is listed.
When finished, click Close.
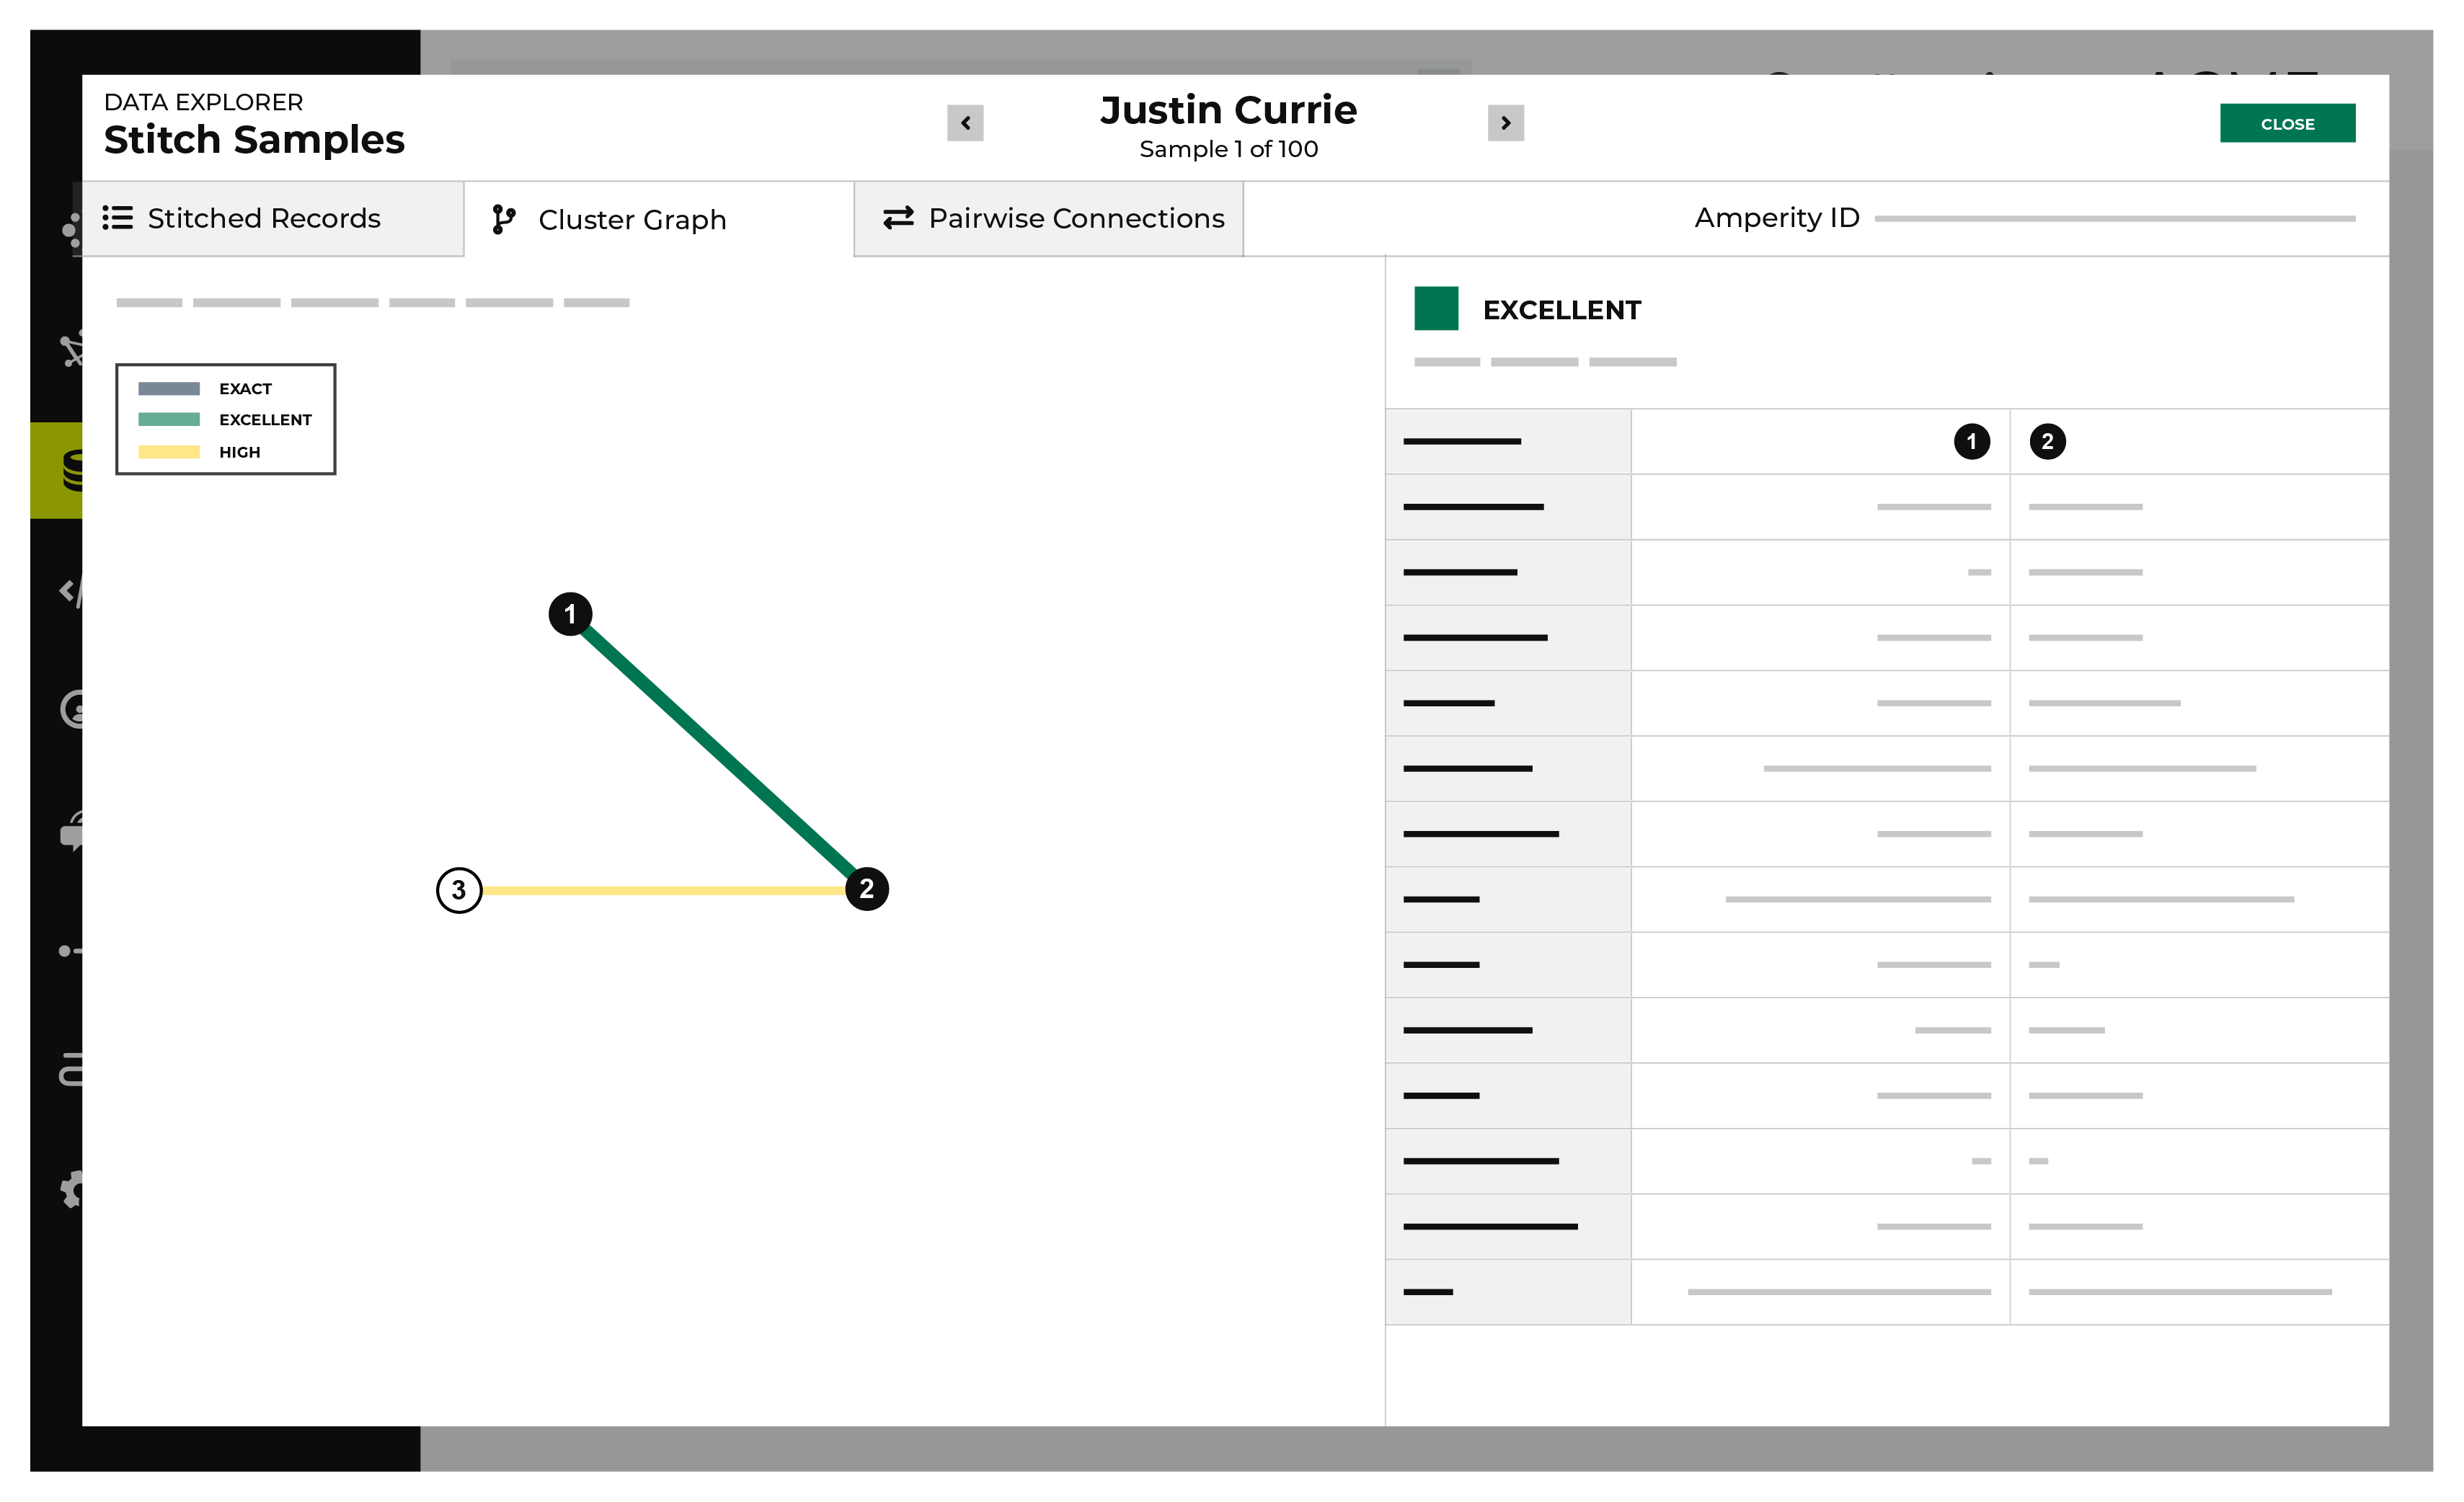
View cluster graph
Clustering is the process of grouping customer records into a customer profile during identity resolution. Distinct customer profiles emerge as connected record pairs.
A cluster graph a visual representation of every pairwise connection in a cluster of records within an identity graph.
The Cluster Graph tab in the Data Explorer shows a graph with a line relationship between each stitched record, along with a detailed breakdown of PII similarities and differences for each pair of stitched records in the cluster graph.
To view the cluster graph
From the Stitch tab, click the Explore Amperity IDs button.
This opens the Data Explorer to the Stitched Records tab.
Click the Cluster Graph tab.
In the cluster graph, select individual lines to view the details for that pair of records. The columns on the right shows the fields in the records that are associated with PII semantics. Compare the values on each side to see how these two records match.
Use the left and right arrows surrounding the full name to view additional cluster graphs for additional record clusters.
When finished exploring, click Close.
View deduplication rate
A deduplication rate represents the total number of unique individuals within an identity graph. This rate measures the difference between the total number of identifiers in source data and the total number of Amperity IDs assigned to unique customer profiles.
Example
A tenant has three sources of customer records represented by tables 1, 2, and 3. In the Stitch report the:
Total number of records is 314.1k
Total number of clusters is 212.0k
Overall deduplication rate is 32.5%
Individual deduplication rates for three customer records are 7.7%, 6.6%, and 0%
How is this possible?
The overall deduplication rate (32.5%) represents the total number of records relative to the number of Amperity IDs. There can be a low deduplication rate on individual tables, but high connectivity between tables.
An UpSet plot chart has a row for each table. In this case, the row for table 1 shows 117k source IDs and 108k Amperity IDs. This represents a 7.7% deduplication rate.
Next compare the overlap between customer records 1 and 3 by hovering over customer record 1. The hover box shows there are more than 69k records shared between tables 1 and 3. This is a significant amount of overlap between two tables and is the primary contributor to the 32.5% overall deduplication rate.
Deduplication rate, explained
The deduplication rate is the reduction that occurs when the total number of Amperity IDs are compared to the original source IDs provided in customer data. For example:
Total records: 314.1k. The sum of all records from all tables.
Total clusters: 212.0k. The sum of all clusters from all tables.
Records in table 1: 117k. The sum of all records in table 1.
Clusters in table 1: 108k. The sum of all clusters in table 1.
The overall deduplication rate is 32.5%:
100 * [(314.1k - 212.9k) / 314.1k] = 32.5%
The deduplication rate for table 1 is 7.7%:
100 * [(117k - 108k) / 117k] = 7.7%
Important
Deduplication rate depends on many factors. The previous example shows deduplication rate for a database that does not use customer keys:
(total customer records - Amperity IDs) / (total customer records)
When a database uses customer keys, the math to determine deduplication rate is the same, but the starting point is the customer keys.
(total customer key records - Amperity IDs) / (total customer key records)
To view deduplication rate
From the Stitch tab, under Overview, review the total source IDs and total Amperity IDs.
The deduplication rate is shown on the right as a percentage.
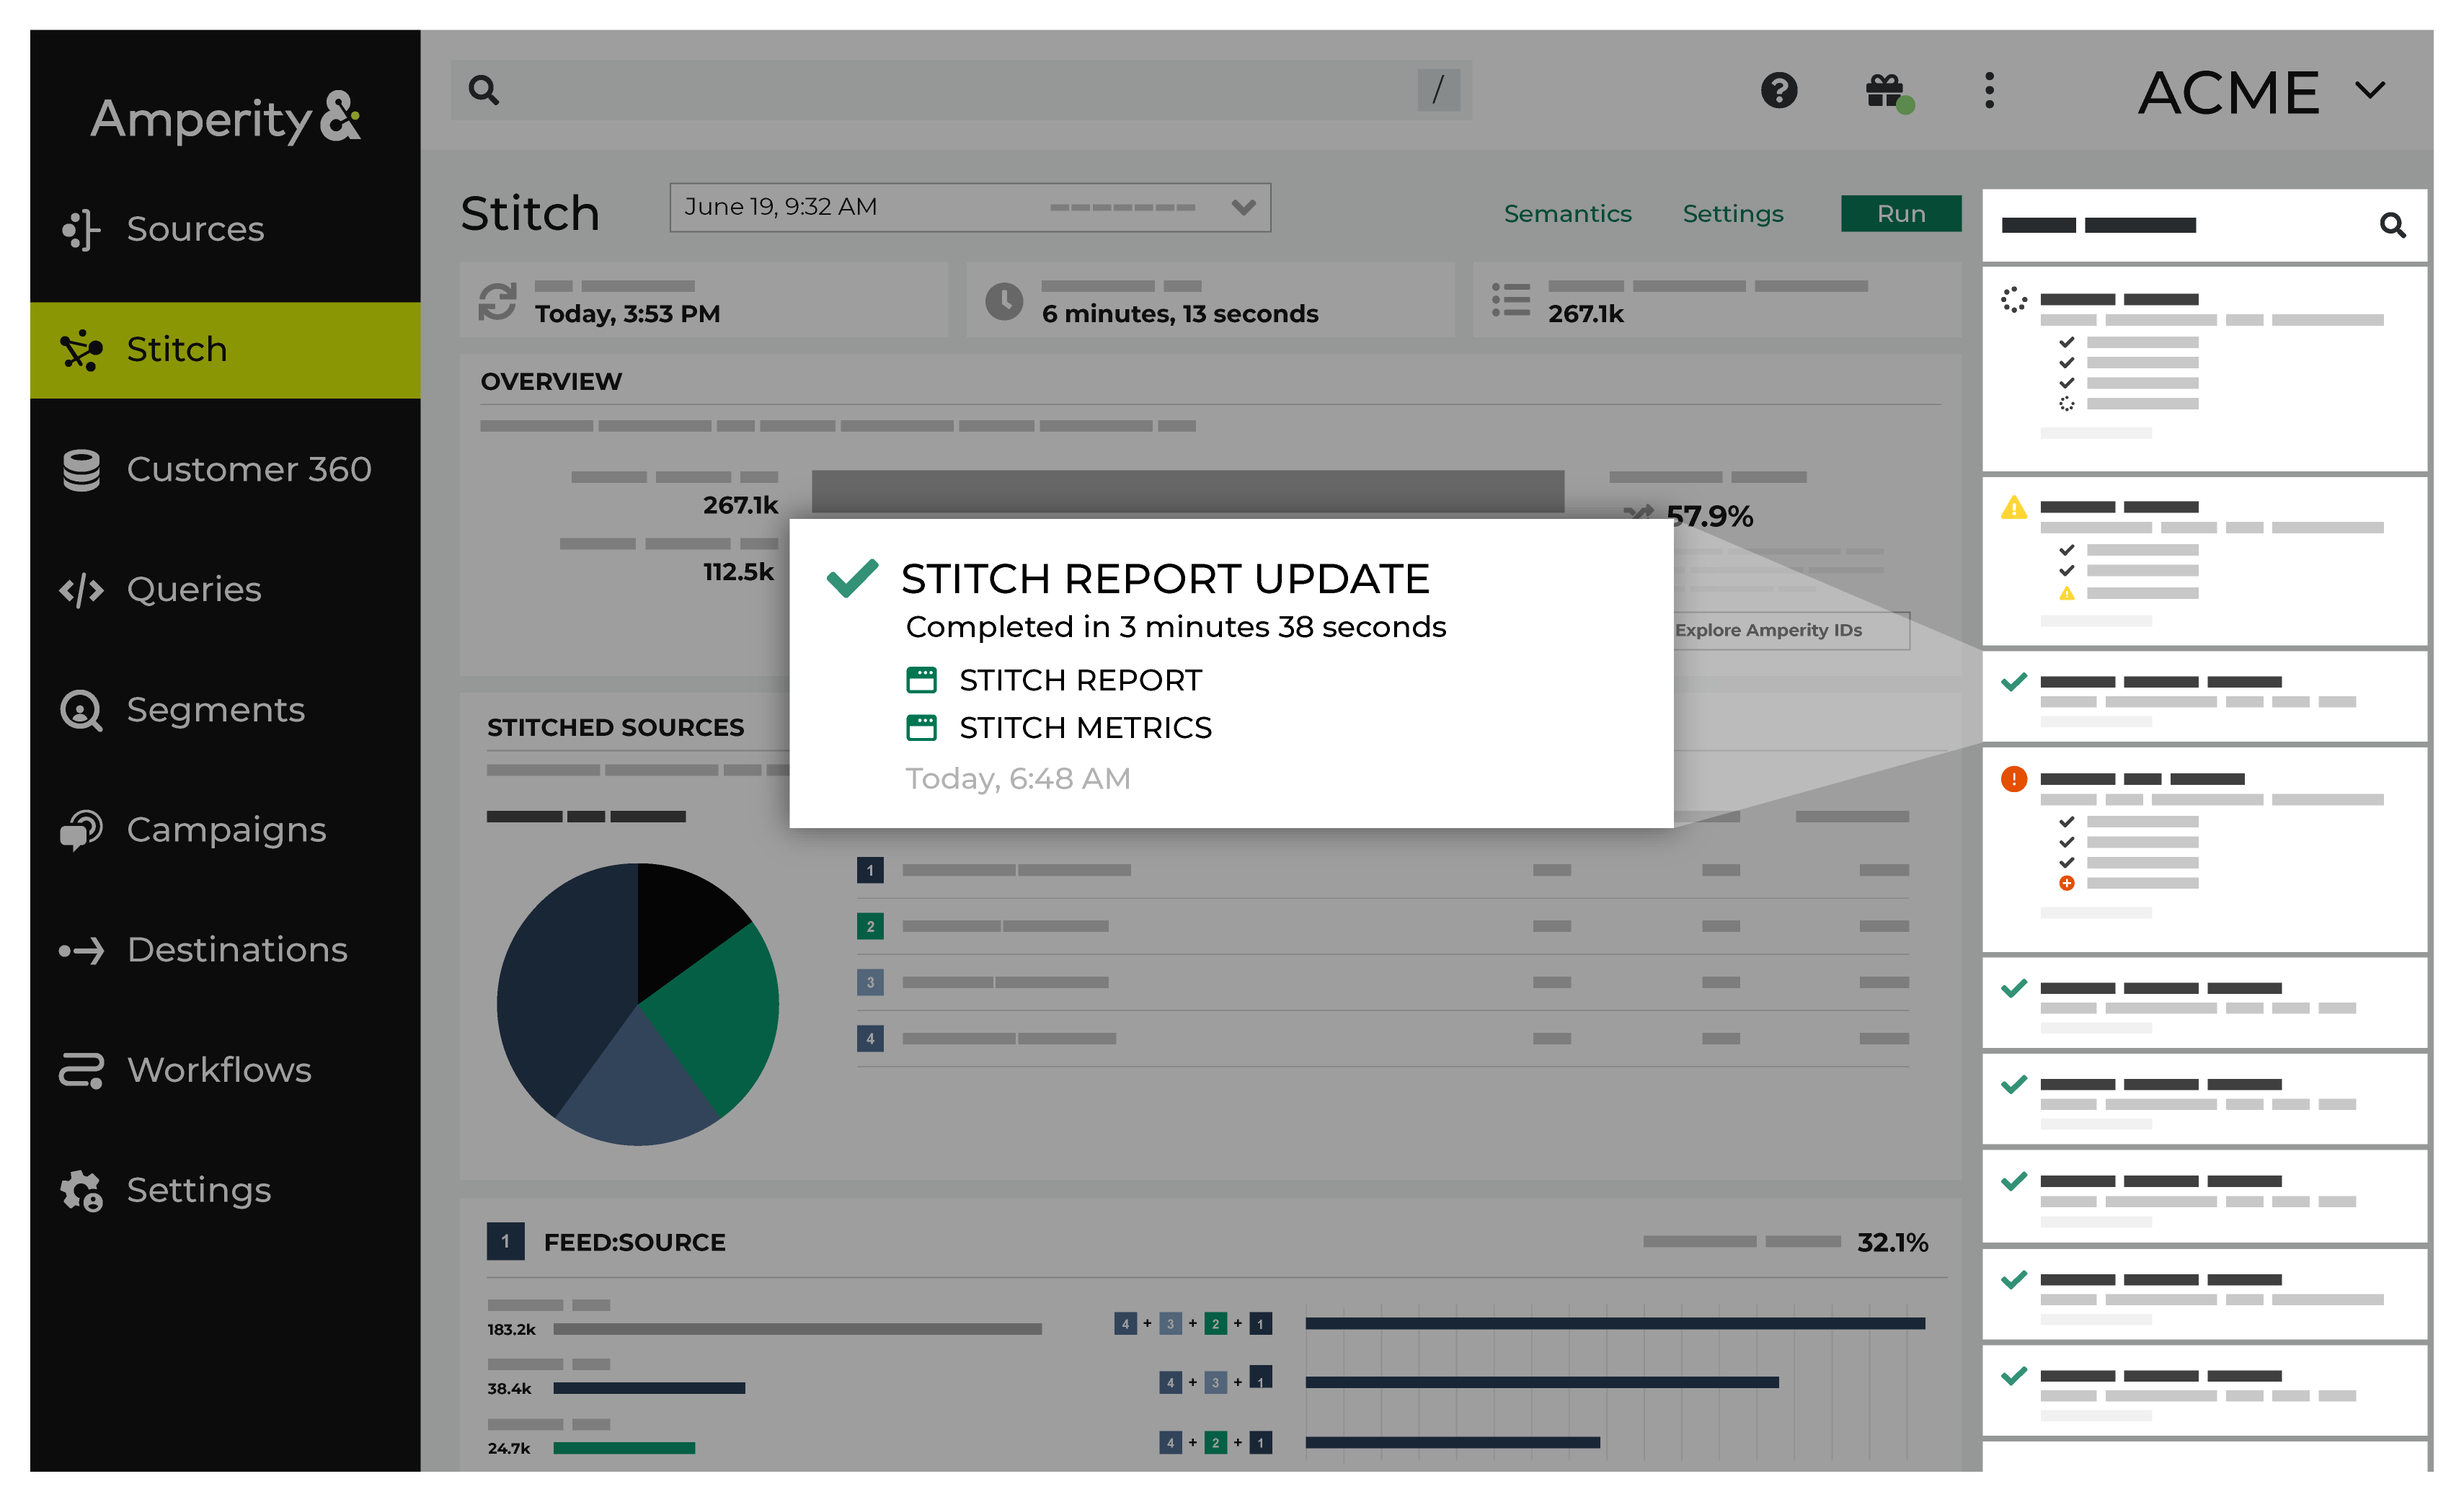
View notifications
Notifications for Stitch reports that run in the Stitch page appear after Amperity creates clusters of records based on the connection between pairs, and then gives each cluster a unique Amperity ID. Notifications typically indicate successful outcomes. Less often, notifications contain details for non-successful outcomes, such as failures related to upstream or downstream processes.
If a notification is about a non-successful outcome, the details for why and what happened can be found in the notification itself. Click More to view the full notification. Click View Workflow to open the workflow in the Workflows page.
In some cases viewing the log files may be helpful. In many cases, fix the root cause of the non-successful outcome, and then rerun the process manually. The Workflows page provides a set of workflow actions that you can initiate directly.
View pairwise connections
A pairwise connection is a pair of matching records assigned a score high enough to belong to the same customer profile.
The Pairwise Connections tab in the Data Explorer shows a breakdown of stitched record pairs by score.
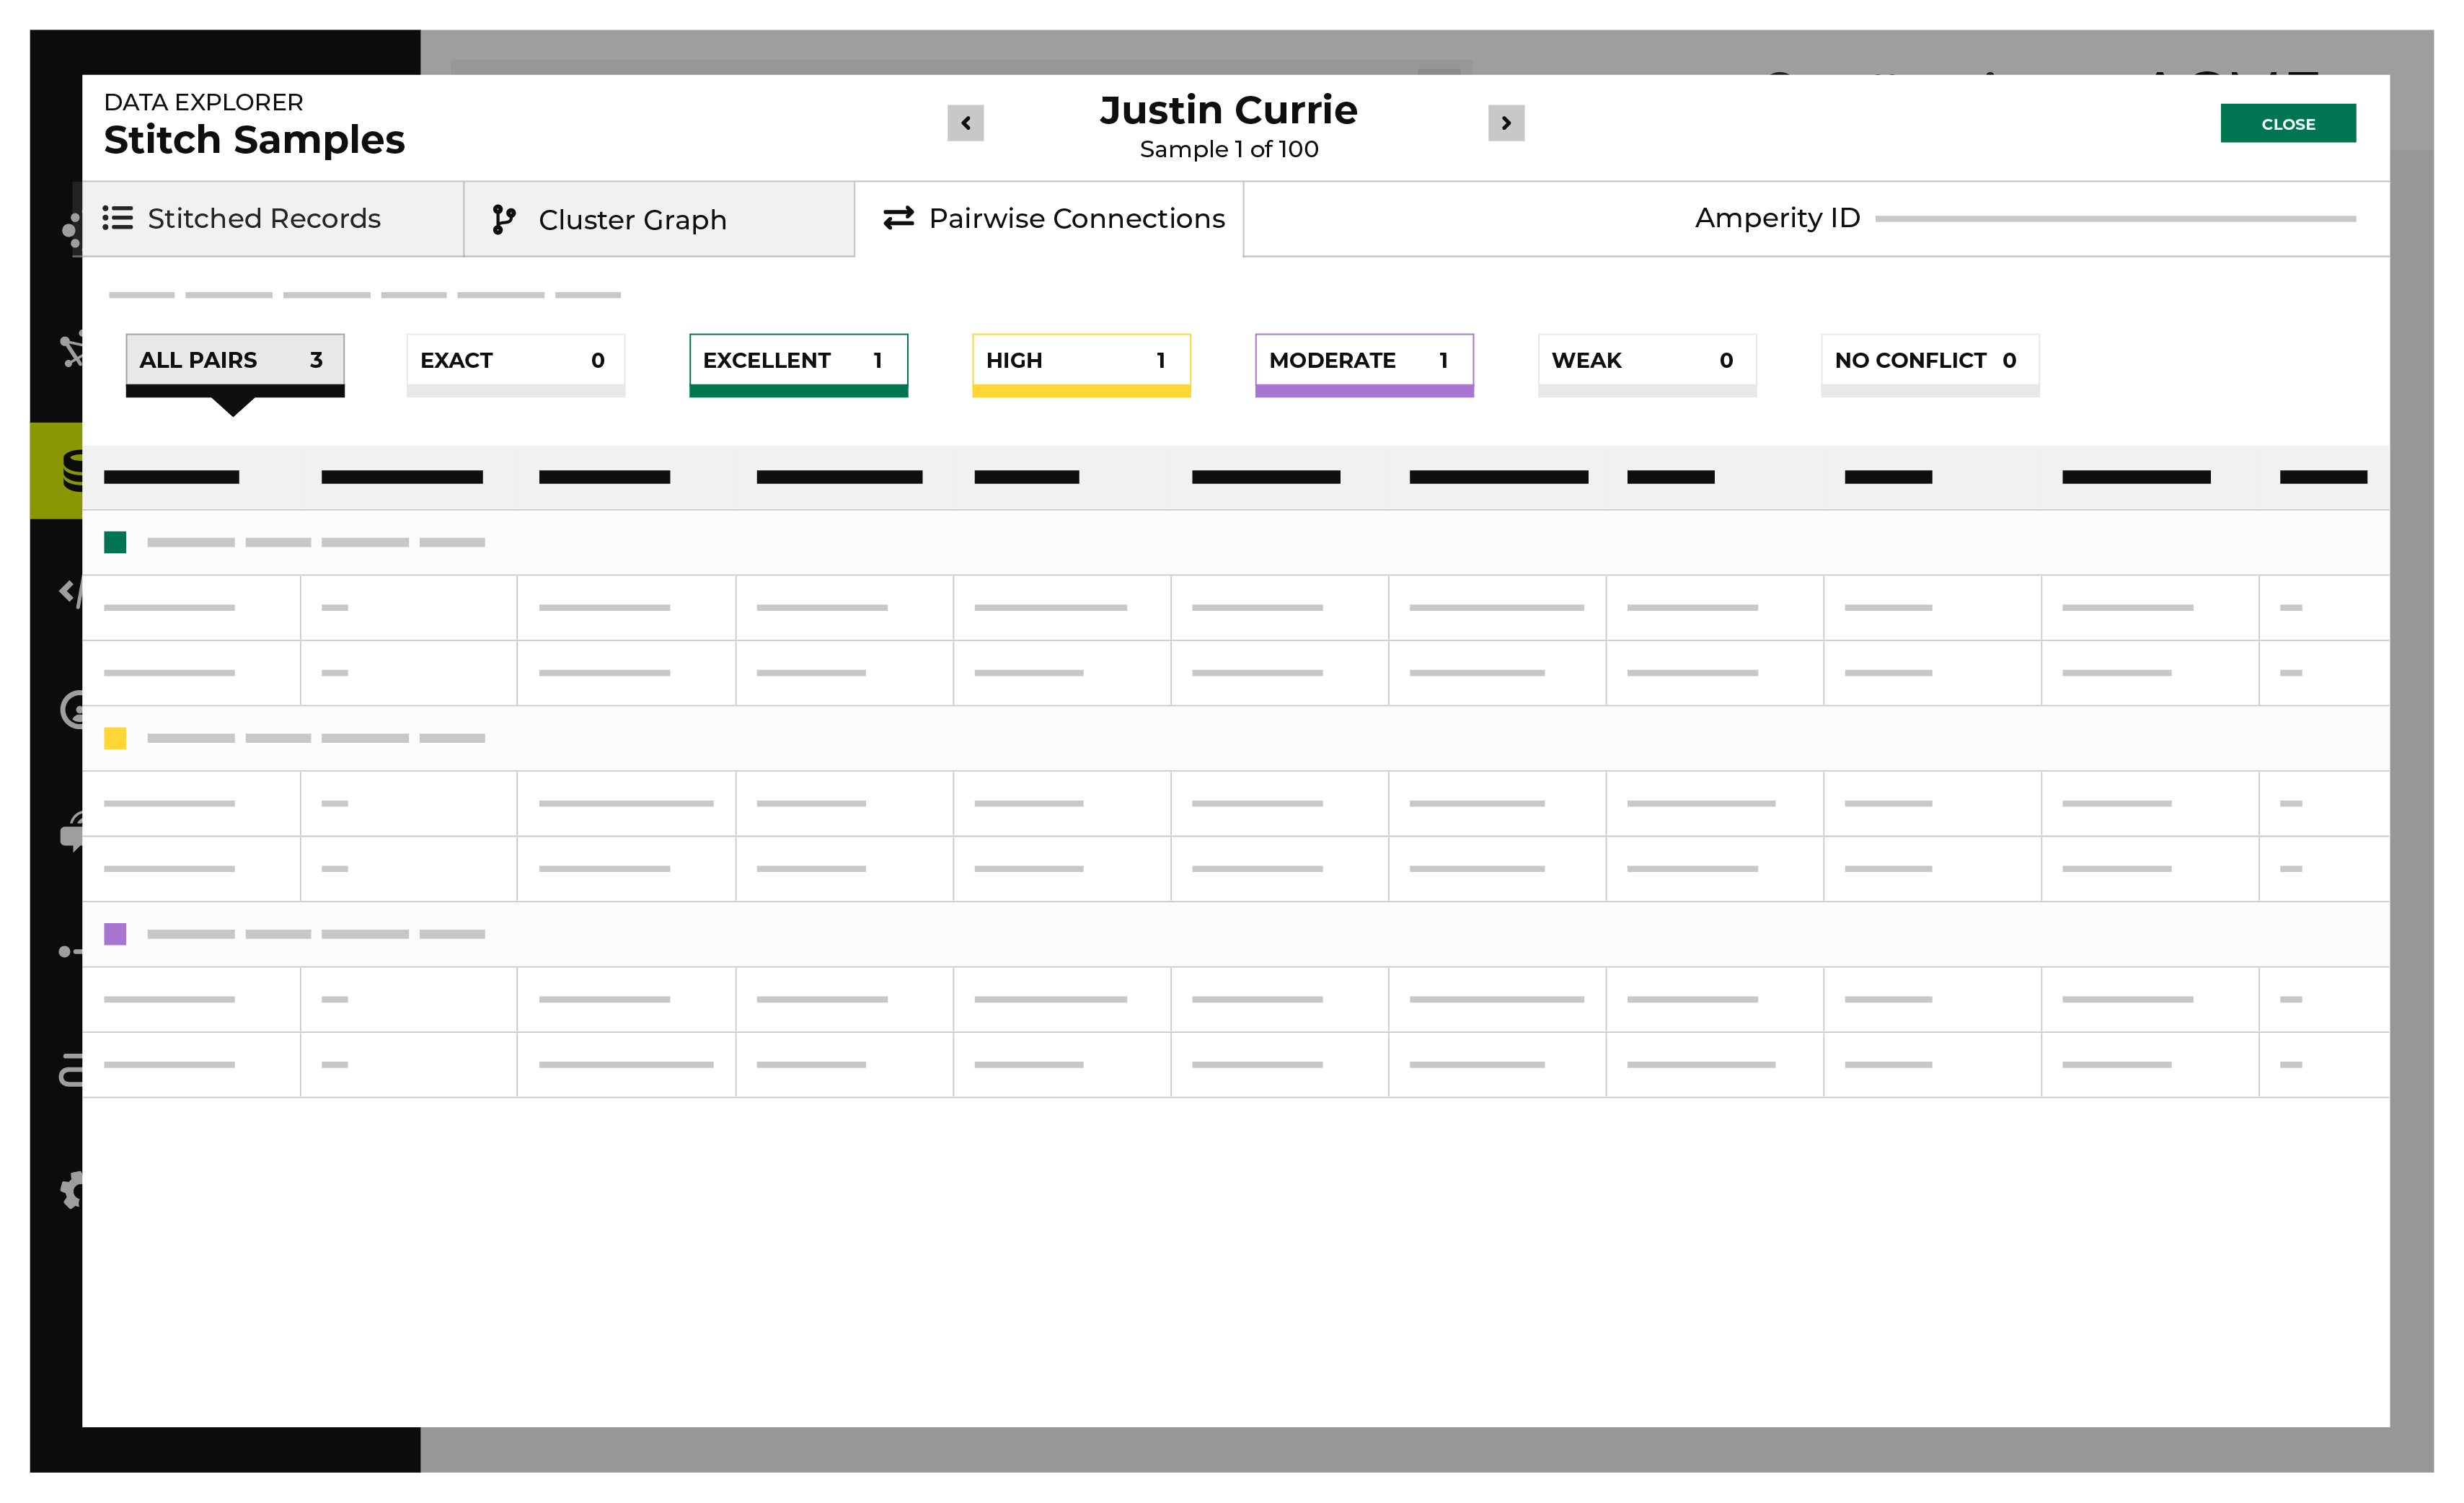
A pairwise connection has a score with two parts separated by a period.
The first part–the record pair score–correlates to the match category, which is a machine learning classifier applied during identity resolution to individual record pairs:
5 for exact matches
4 for excellent matches
3 for high matches
2 for moderate matches
1 for weak matches
0 for non-matches
Identity resolution uses the second part–the record pair strength–to show the quality of the record pair score. This value appears in the Stitch report as a two decimal number. A record pair strength by itself is not a direct indicator of the quality of a pairwise connection score.
To view pairwise connections
From the Stitch tab, click the Explore Amperity IDs button.
This opens the Data Explorer to the Stitched Records tab.
Click the Pairwise Connections tab.
Pairwise connections are broken into categories by strength of connection: exact matches, excellent matches, high matches, moderate matches, weak matches, and no matches. Click each category to view individual records by strength of connection.
Use the left and right arrows surrounding the full name to view additional pairwise connections for additional record clusters.
When finished exploring, click Close.
View Stitch metrics
You can view metrics for changes to records and Amperity IDs that may have occurred between Stitch runs. Click the Stitch Metrics link in the notifications pane to open the Stitch Metrics dialog box.
This dialog box identifies the tenant, the time at which the job started, the ID for the Stitch report, and the Stitch ID, and then shows the following details about this Stitch run:
The collapsed ID count refers to the number of records present after nearly identical records were removed.
The related pairs count shows number of unique record pairs that were identified by a blocking strategy.
The filtered related pairs count shows the number of unique record pairs that scored above the matching category threshold.
The table has a row for each data source that was made available for identity resolution, along with columns for each row that show:
The number of Amperity IDs in the current Stitch run.
The number of Amperity IDs in the previous Stitch run.
The number of Amperity IDs in the current Stitch run that were not in the previous Stitch run.
The number of Amperity IDs that were in the previous Stitch run, but are not in the current Stitch run.
The number of distinct cluster transitions. A cluster transition occurs when records move from one cluster to another.
The number of distinct cluster transitions, including those from records added to or deleted from the dataset.
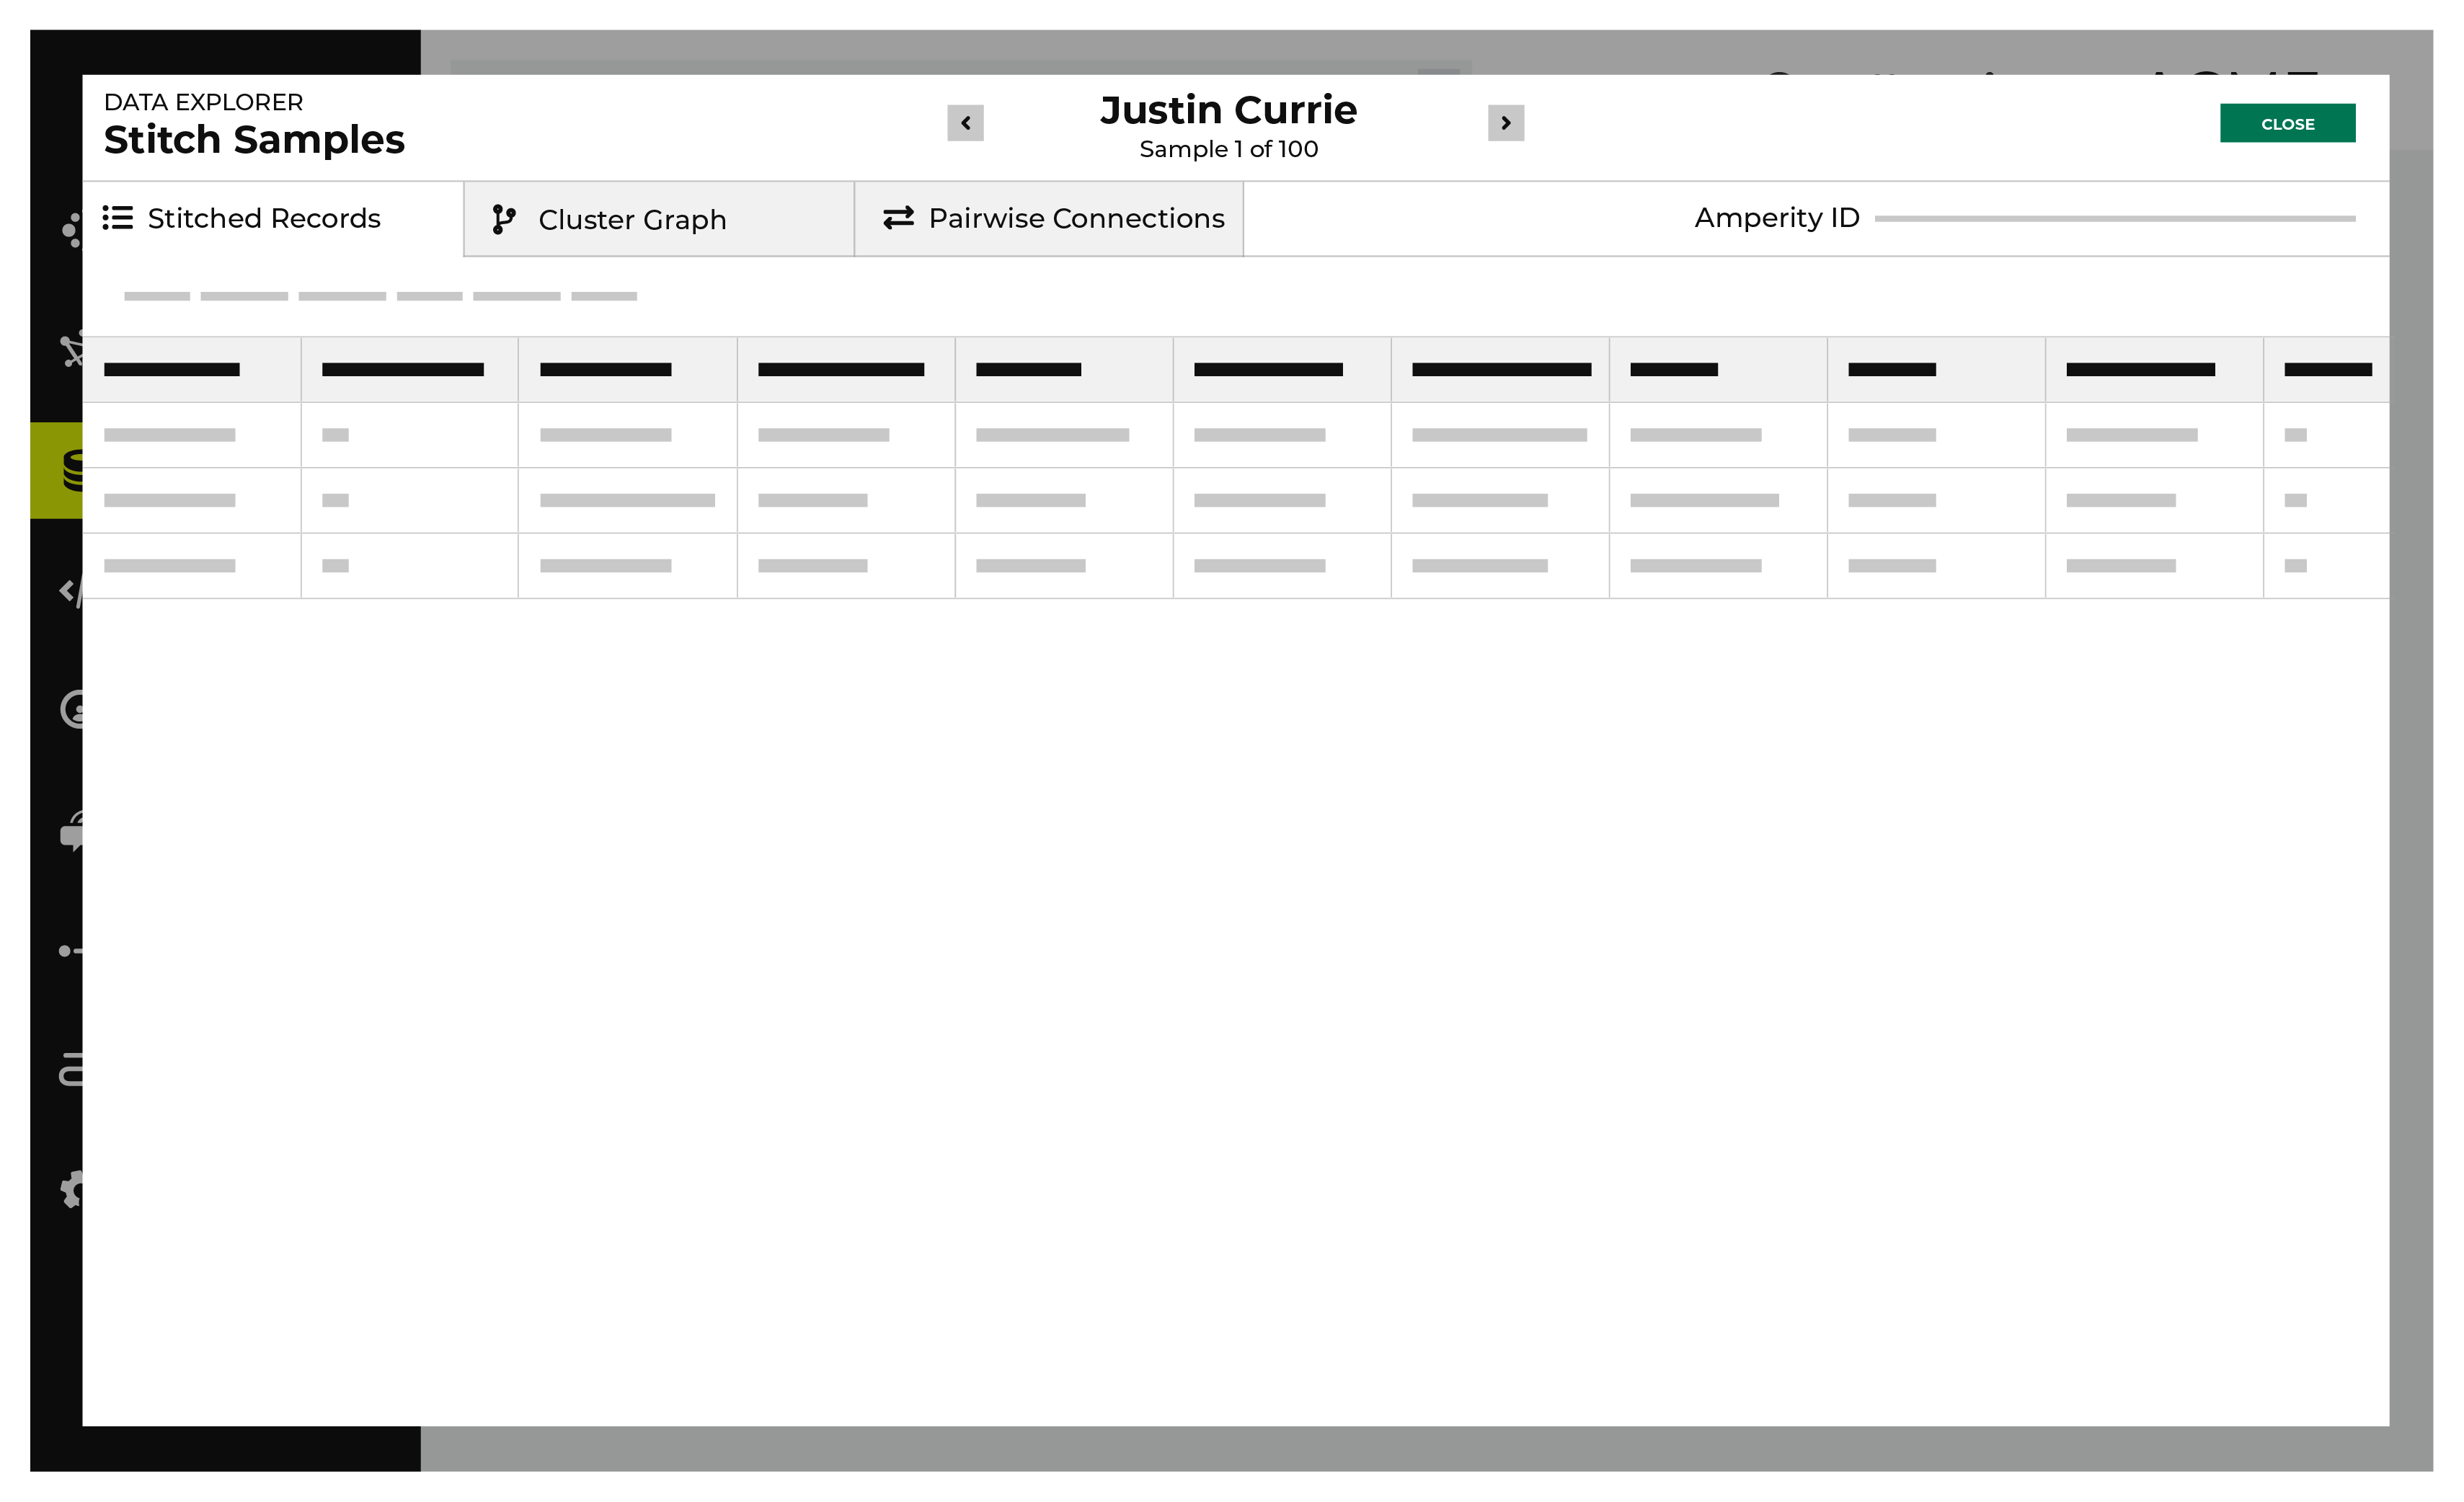
View stitched records
A stitched record is a unique output of identity resolution that associates the Amperity ID to customer records in source tables.
The Stitched Records tab in the Data Explorer shows a table with a row for each of the individual records that share the same Amperity ID.
To view stitched records
From the Stitch tab, click the Explore Amperity IDs button.
This opens the Data Explorer to the Stitched Records tab.
All of the records that are associated with the same Amperity ID are listed. Columns show the differences beween each record.
When finished exploring, click Close.
View profile attributes and interactions
The Profile attributes and Interactions tabs are available in the data explorer. These show information about customer 360 attributes and interaction records for an individual customer.
To view profile attributes
Create a database with the Unified Scores and Unified Customer tables, and add a customer 360 table that is tagged with a table semantic.
In the query editor select the database.
Create and run a query that returns a list of customers.
Click an Amperity ID in the results to open the data explorer.
On the Interactions tab, select a table in the Show matching records from field.
View each interaction record.