About Amps consumption
Consumption is measured in Amps and Storage (TB). Amps consumption is measured across your entire production and sandbox environments. Actions such as running workflows and querying data will consume Amps. Amps consumption is assigned to the day on which consumption started. Monitor your Amps and Storage (TB) consumption in the Amps dashboard.
You can also use Amp Insights to ask natural language questions about your usage.
Important
The Amps dashboard is not available from a sandbox. The Amps dashboard in the parent tenant tracks Amps consumption, including Amps consumed by a sandbox.
Amperity Learning Lab
Amps are a normalized unit that measure total consumption across categories and features within the Amperity platform.
Open Learning Lab to learn more about what are Amps . Registration is required.
Consumption overview
Consumption is measured in Amps and Storage (TB). Amps measure the amount of compute resources that are used within the Amperity platform, such as running workflows or sending campaigns.
The storage that is required to support those compute resources is measured in terabytes (TB).
Some examples of consumption drivers are:
The amount of data that is processed.
The amount of data that is stored.
The complexity of operations, such as complex SQL join operations, and the memory that is required to complete those operations.
The amount of time it takes to run a workflow.
The size of the compute resources that are available in your tenant.
Consumption alerts
Configure Amperity to send email alerts when Amps consumption exceeds a configured threshold. Use Amps alerts to keep track of overall consumption, especially for when consumption is higher than expected. The consumption threshold may be adjusted over time.
To configure Amps consumption alerts
Open the Amps page.
Click the Automated Amps alerts link in the top right.
In the Automated Amps alerts dialog box:
Configure a threshold for daily Amps consumption. A good starting threshold for Amps consumption is 150% of your tenant’s average daily Amps consumption. For example, if your tenant consumes, on average, 100000 Amps per day, configure the initial threshold to be 150000. This threshold may be adjusted over time.
Enter one or more email addresses to which Amps alert email messages are sent. The email address may for individual users and it may be an alias.
Click Save
Amps consumption
Some features consume more Amps than others. Compute-intensive features, such as running Spark SQL and Presto SQL queries, processing data, and algorithms, such as Stitch or predictive models, will consume Amps at a higher rate. Compute includes actions like loading data, querying data, running databases, refreshing predictive models, and running Stitch. Consumption of Amps based on compute depends on the features that are in use, the frequency at which they are run, and the amount of time it takes for the process to finish. Compute consumption can vary from day to day.
The following features have configurable compute settings:
Ingest
Source transforms
Stitch
Stitch reports
Databases
Spark SQL queries
Your brand can explicitly set the compute sizes for these tasks in your workflows. Changes to compute settings will affect Amps consumption. Contact your Amperity representative with questions around how to best configure compute resource sizing within your tenant.
Storage consumption
Storage does not consume any Amps. Instead, storage is measured separately, in Terabytes (TBs). Most customers spend less than 5% of their total consumption on Storage.
Similarly to Amps, Storage consumption is attributable to the product feature where that data is stored. Additionally, all storage can be attributable to the environment (production and individual sandboxes) where it is stored.
Creating and using short lived sandboxes typically does not consume a high level of additional storage as these sandboxes are able to reuse some of the same storage as Production. However, if sandboxes are not deleted after they are used, then their storage can accumulate and even become the majority of the storage consumption. If you have high storage consumption, review which of your sandboxes are no longer necessary and can be deleted.
Note
Storage does not consume any Amps and is metered separately in TBs. Typically, storage is less than 5% of total consumption.
Important
A sandbox is a replica of your production environment. It starts as an exact duplicate of the configuration of your production tenant at the time it is created. It starts with access to the same data that is stored in your production tenant. If new data is ingested into the sandbox, added storage increases your Amps consumption.
Amps dashboard
The Amps consumption dashboard shows your brand’s total Amps and storage (TB) consumption across configurable time periods along with a breakdown of Amps consumption by category and by feature.
You can access the Amps dashboard from the menu that is located in the top-level navigation next to the name of your Amperity tenant.
Note
The dashboard may exclude up to 24 hours of data, to allow time for data processing and validation.
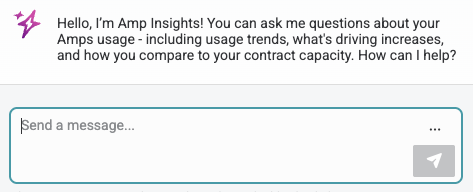
Amp Insights
Use Amp Insights to ask natural language questions and understand your Amps usage and consumption.
The following examples show some of the questions you can ask while working in the Amps dashboard:
“What caused my Amps spike on Jan 12th?”
“Give me a breakdown of how I am spending my Amps.”
“Which campaign consumes the most Amps?”
Current contract
The Current contract section shows the state of the tenant for the current contract period. It displays the following information:
Capacity consumed against the total capacity purchased
Time remaining in the current contract period
Overall Amps vs storage (TB) breakdown
Consumption broken down by environment
Consumption breakdown
The Consumption breakdown section shows Amps consumption by category and by feature. You can choose to view the dashboared for Amps or Storage (TB) in the filter bar. You can also filter by time period, view Amps at daily, weekly, or monthly scales, and filter by production tenant or by sandbox.
The Consumption breakdown can be filtered by date range, by tenant type, shown daily, weekly, or monthly.
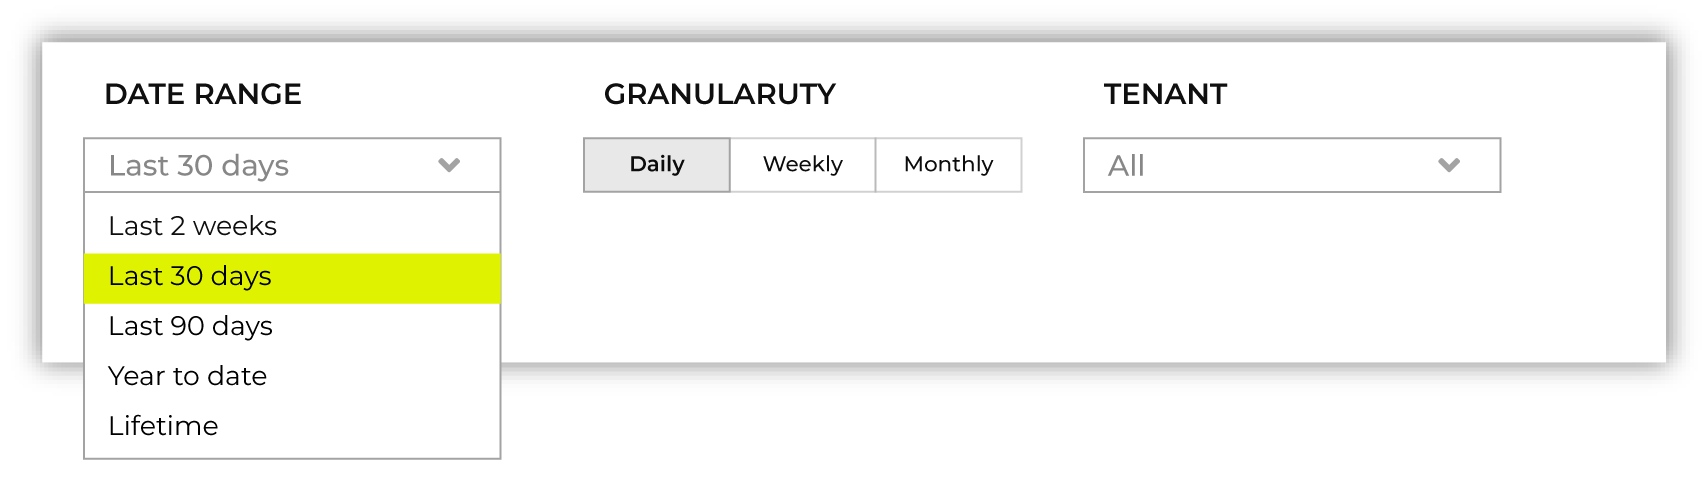
Each option is set independently:
Use the Date range dropdown to select one of the following values: Last 2 weeks, Last 30 days, Last 90 days, Year to date, Current contract period, or Lifetime.
Use the Granularity field to set the granularity of the charts shown for Amps consumption. Choose one of Daily, Weekly, or Monthly.
Use the Type field to set the unit of information that the dashboard displays. Choose one of Amps or Storage (TB).
Use the Category dropdown to view the dashboard for a selected product category. Choose one of All, Sources, Stitch, Databases, Analytics, or Activation.
Use the Environment field to view the dashboard for all tenants, only your production tenant, only sandboxes, or a specific sandbox. Choose one of All, Production, or Sandbox.
For example, set the date range to “Last 90 days”, and then choose “weekly” and “sandboxes” to view Amps consumption for all sandboxes during the last 90 days, with consumption shown by week.
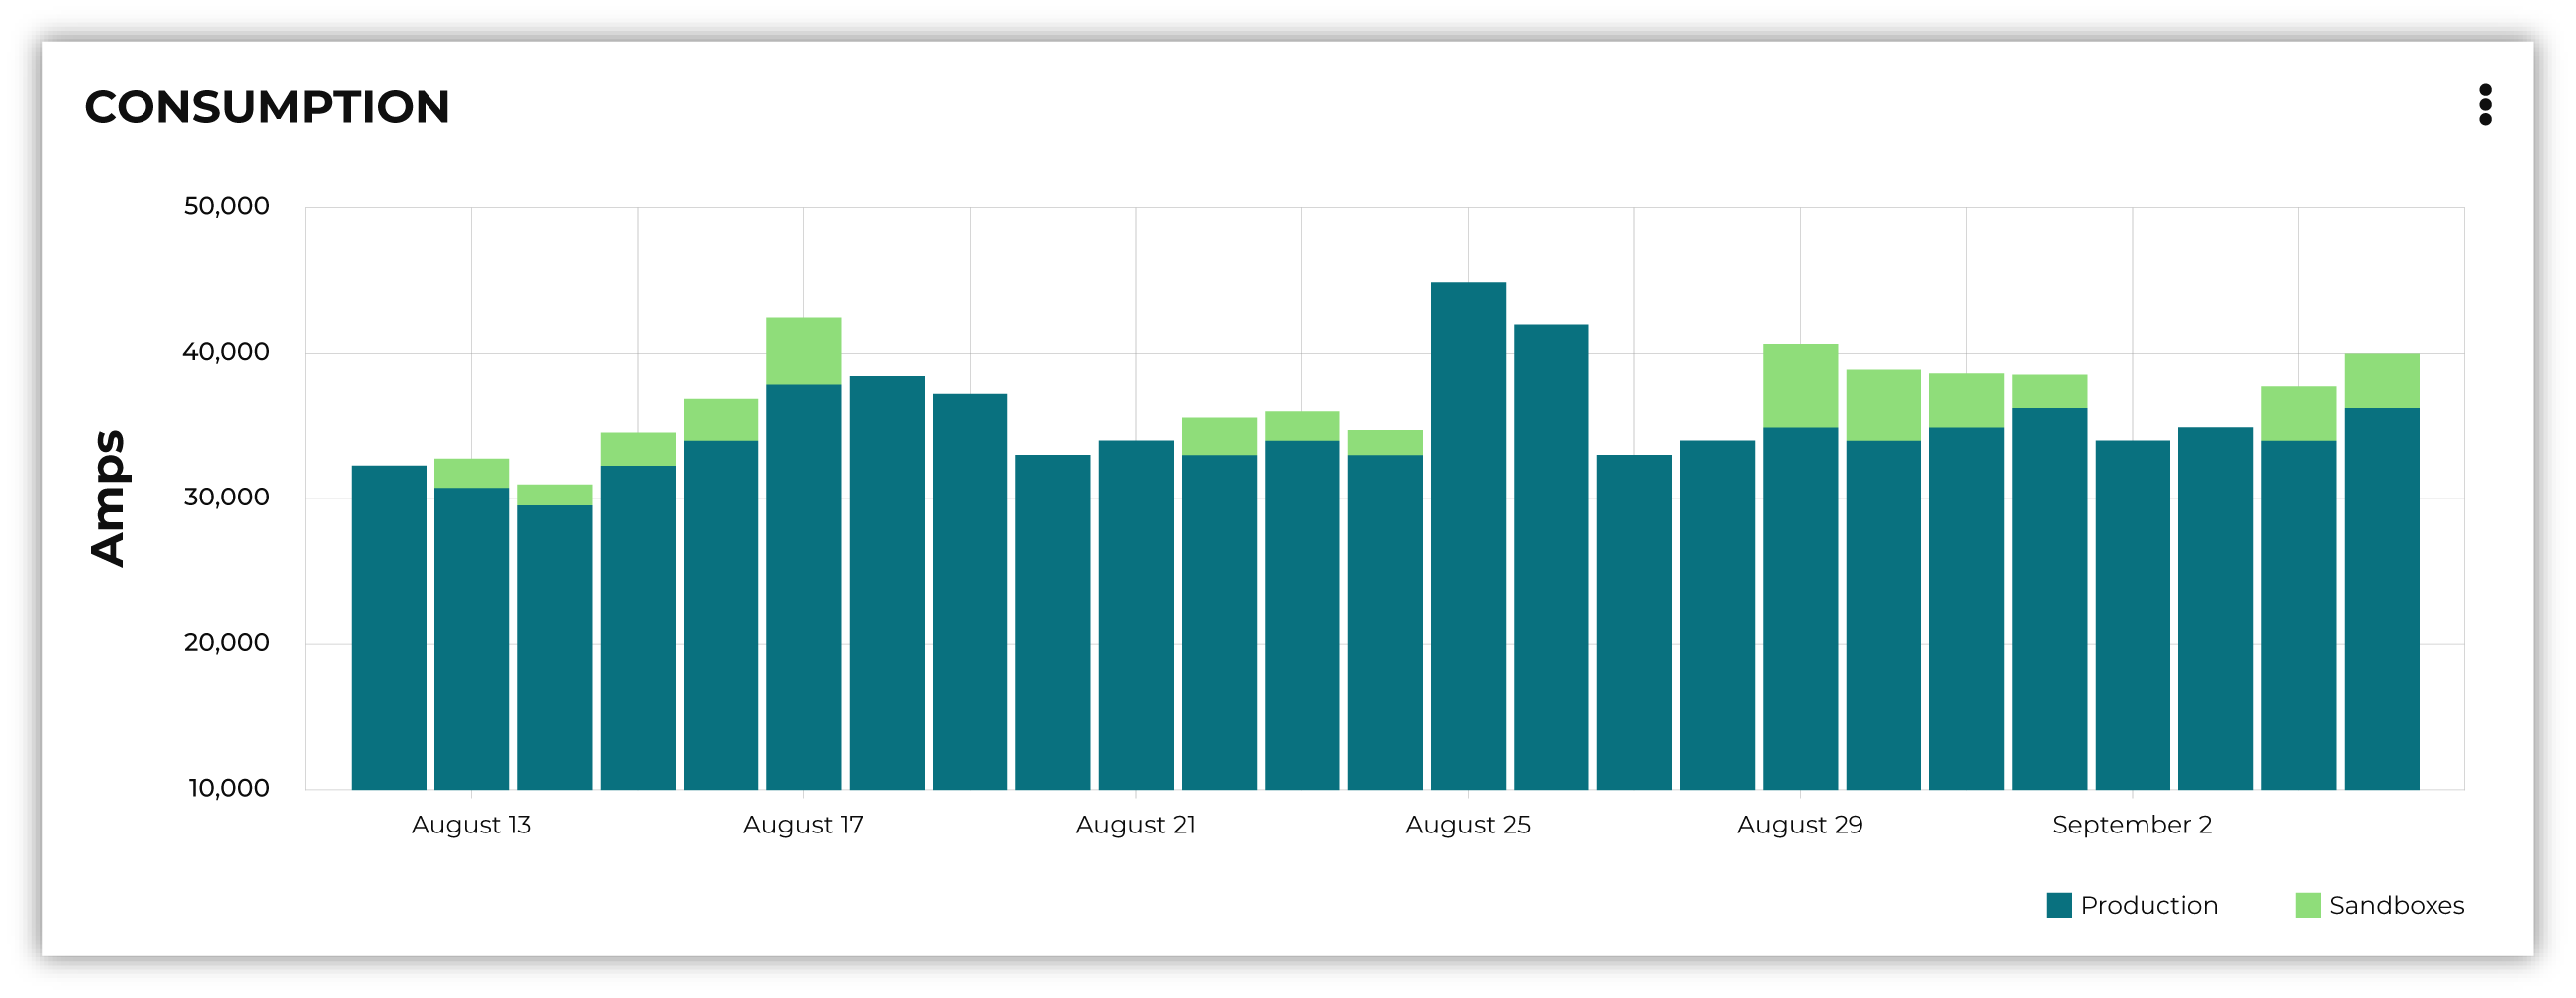
Default view
The default view shows total Amps, including your production tenant and all sandboxes. Filters are applied to all categories and features within the Consumption breakdown section.
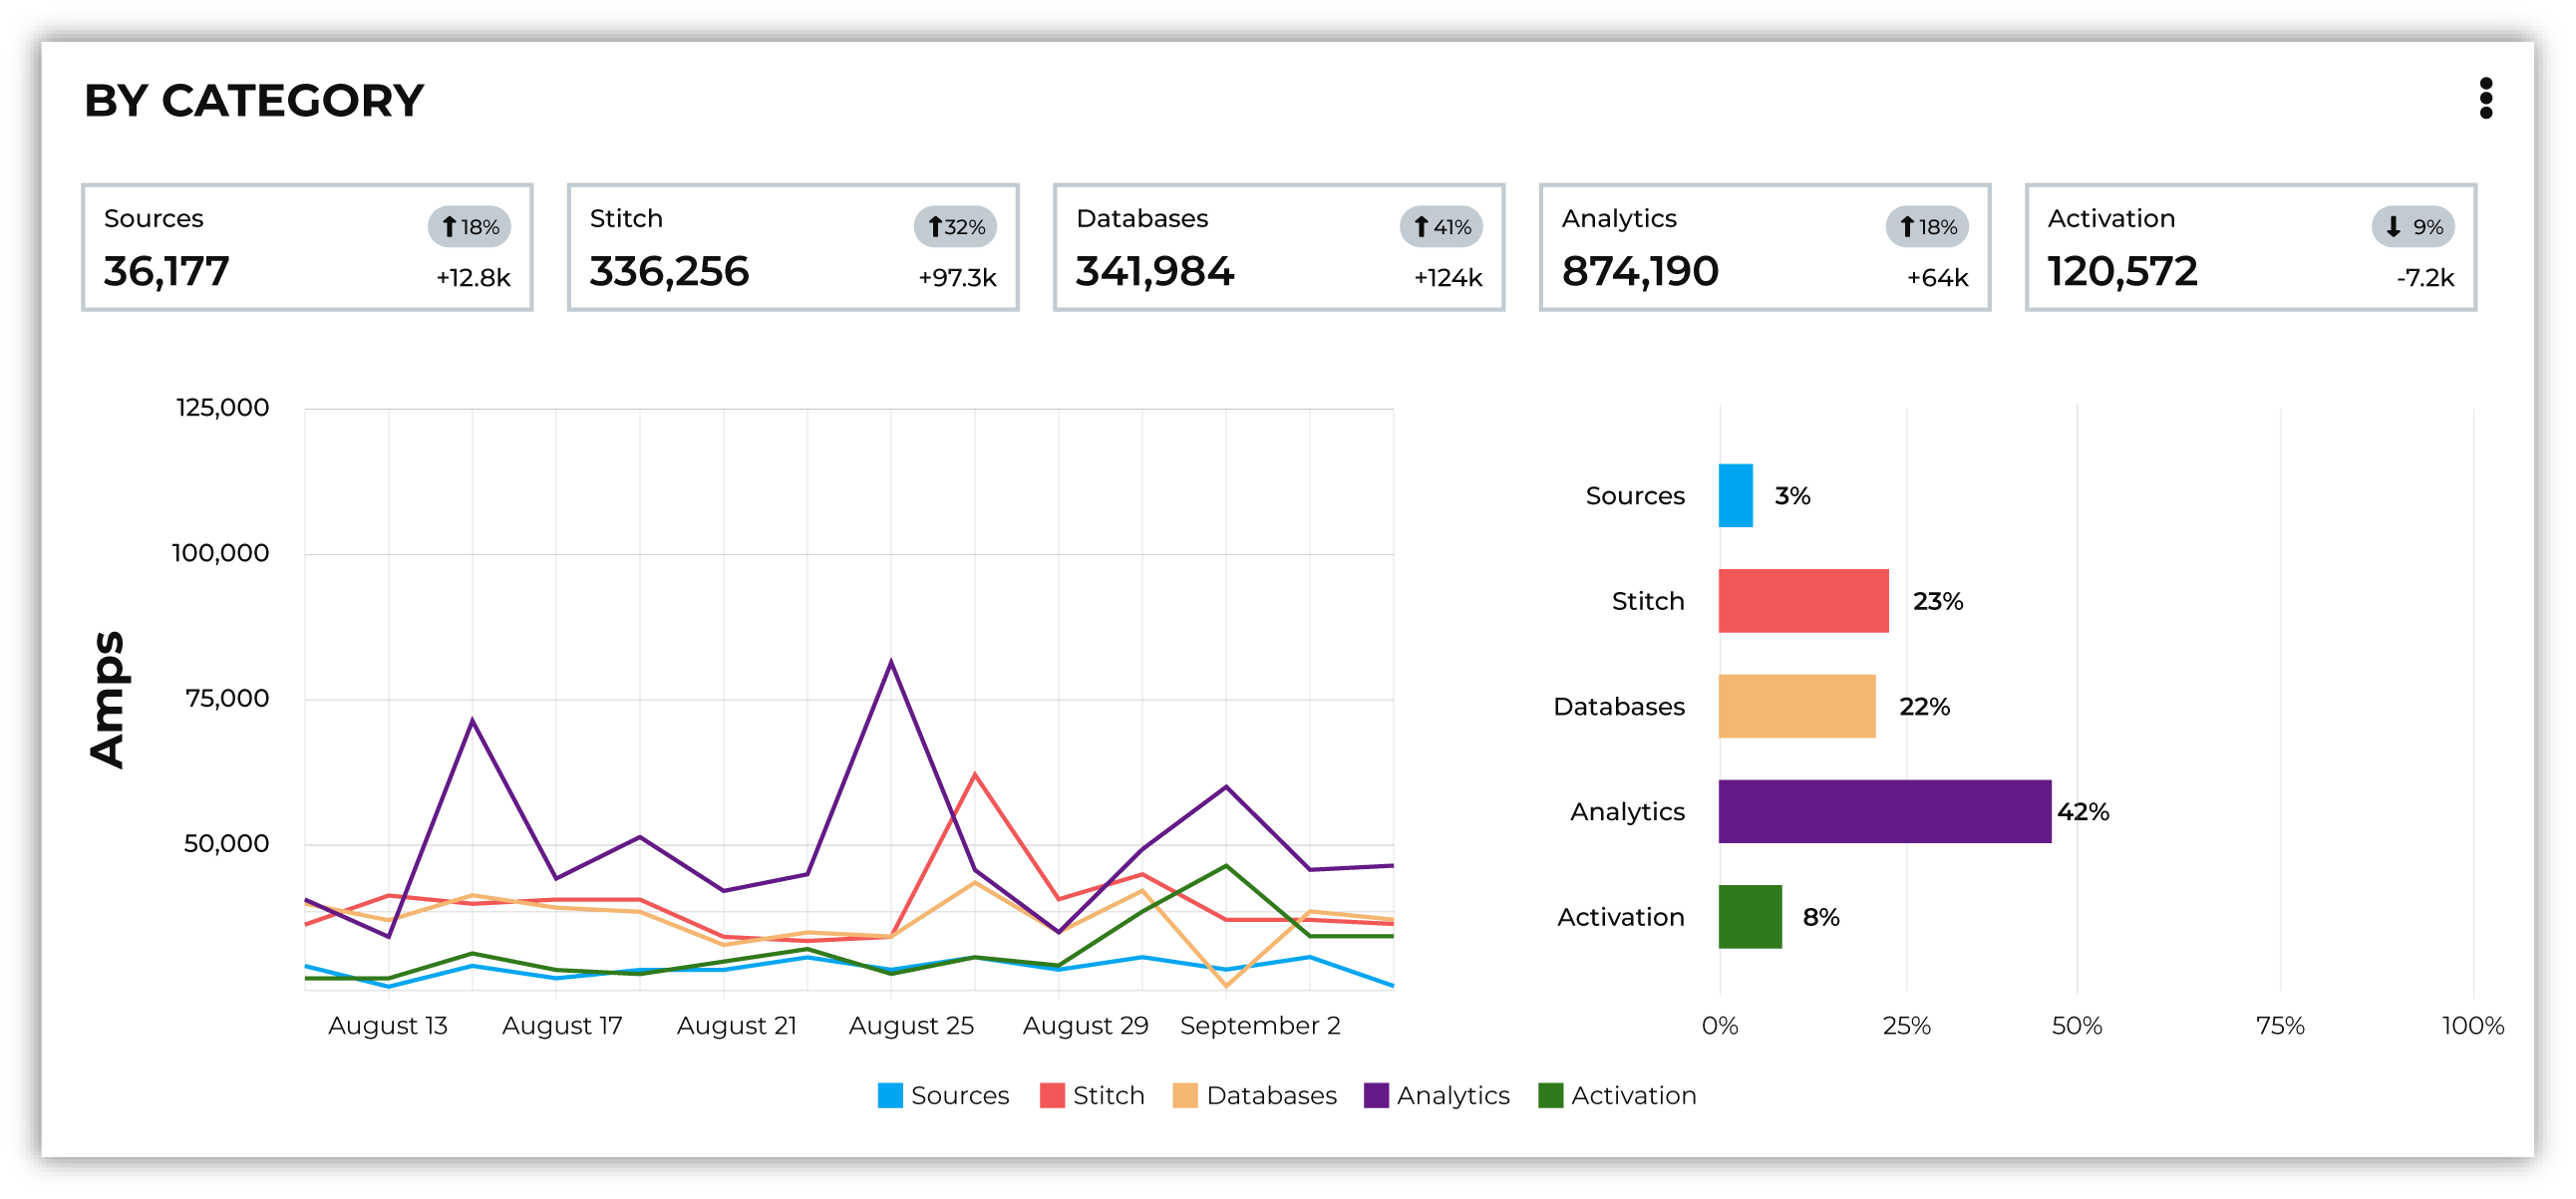
By category
Consumption breakdown by category shows which category–Sources, Stitch, Databases, Analytics, or Activation–has changed the most between the current and previous time periods, along with the distribution of Amps consumption within the current time period.
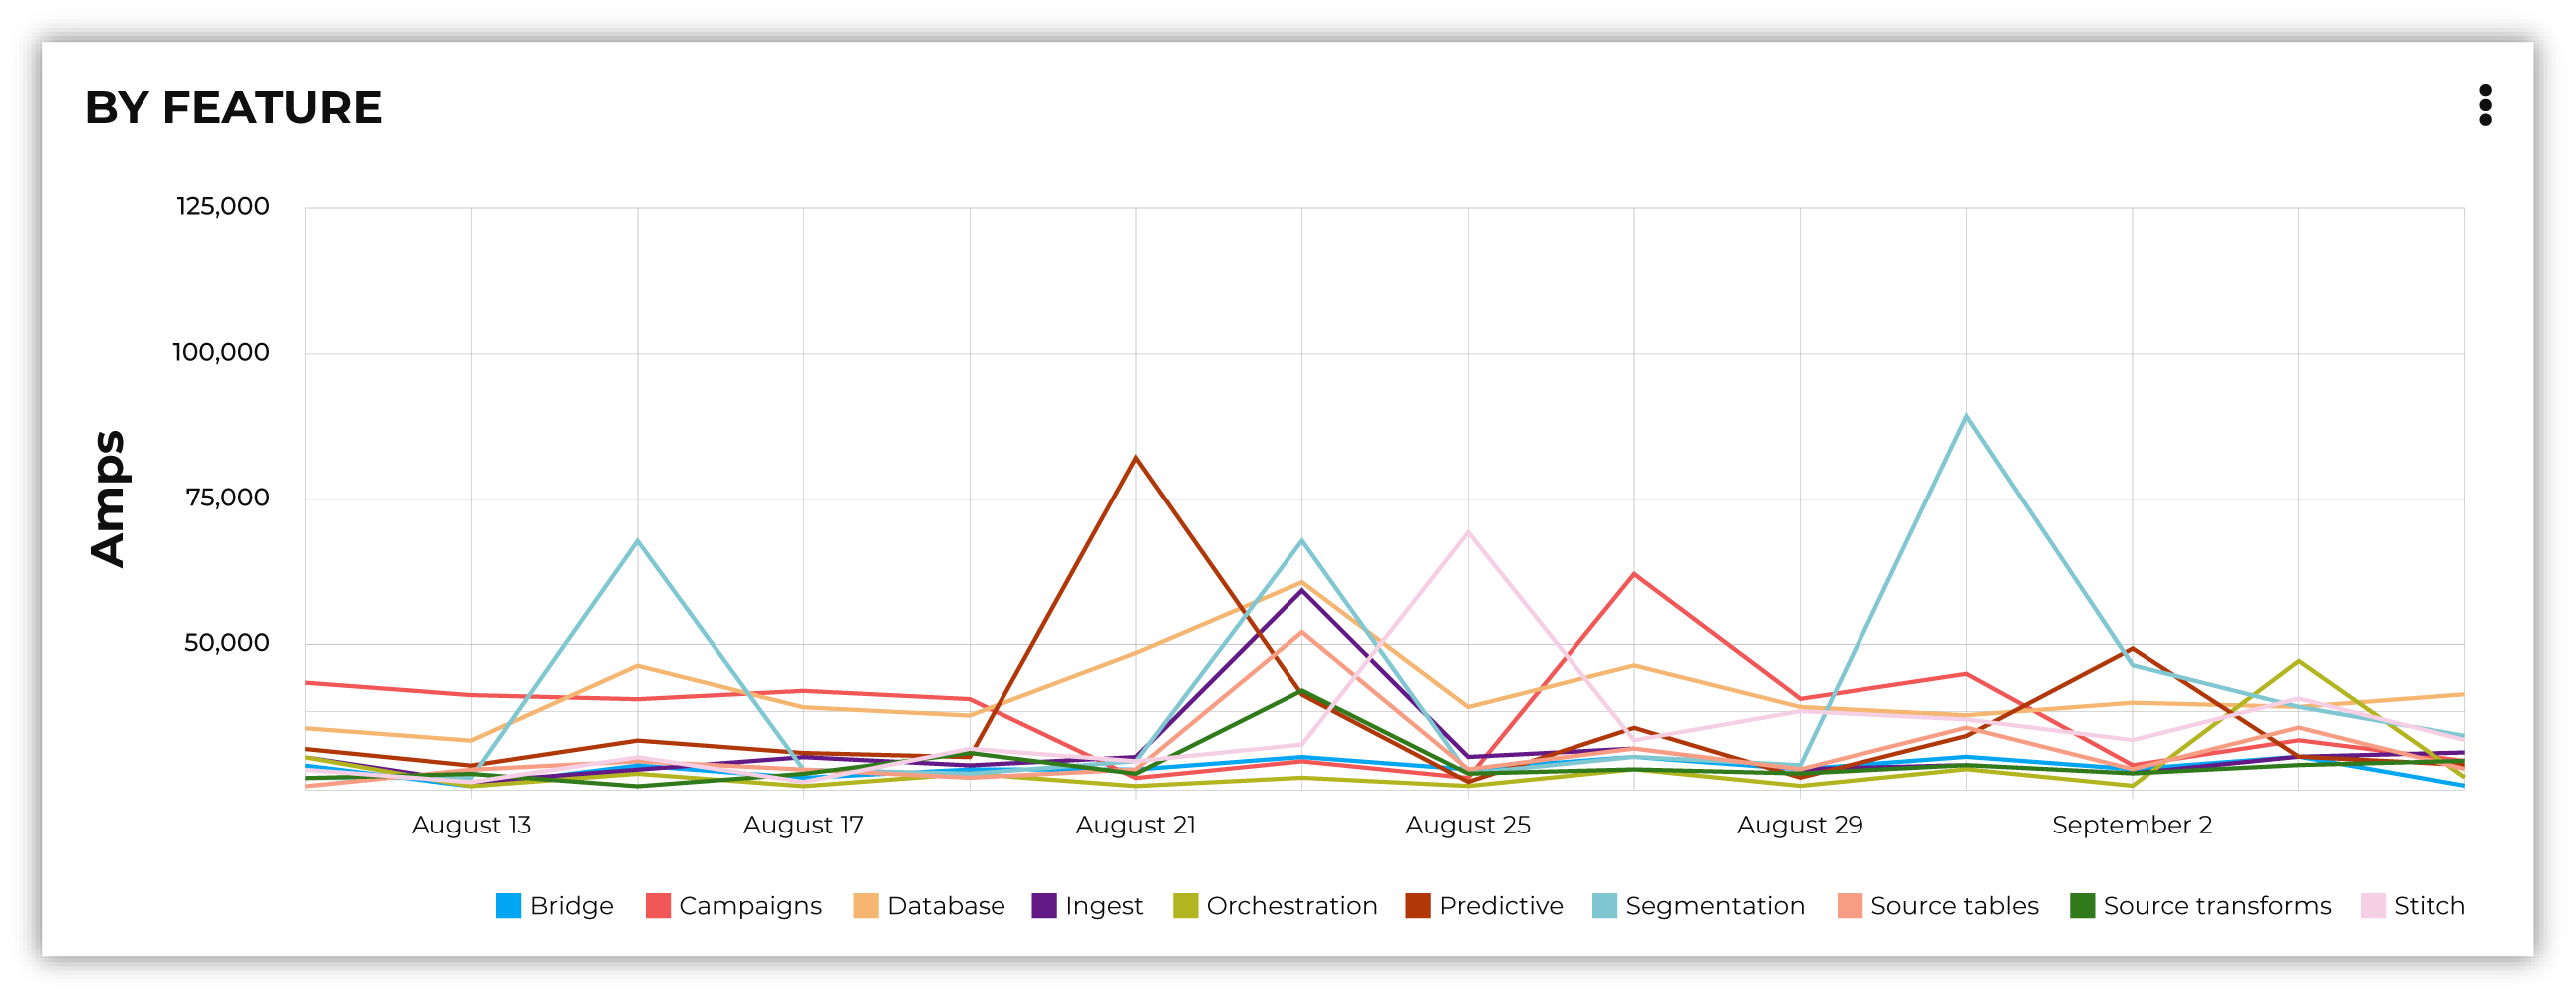
By feature
Consumption breakdown by category shows which feature–BI Connect, Bridge, Campaigns, Databases, Ingest, Orchestrations, Predictive modeling, Profile API, Segmentation, Source tables, Source transforms, or Stitch–has changed the most between the current and previous time periods, along with the distribution of Amps consumption within the current time period.
Consumption categories
Amps and storage (TB) consumption is tracked in 5 categories–Sources, Stitch, Databases, Analytics, and Activation–and is further broken down into product features.
Category |
Feature areas |
|---|---|
Activation |
Campaign audience building Data sent to cloud storage Data sent to managed connectors Journey audience building Orchestration audience building Profile API |
Analytics |
BI Connect Predictive Queries Segments Spark SQL sessions |
Databases |
Databases |
Sources |
Bridge Ingest Tables Transformations |
Stitch |
Stitch Stitch Report |
Consumption by feature
A description of each feature and the actions you can take to influence your Amps and storage consumption. It includes information on what specifically drives consumption in that area, and areas of the product where you can monitor your tenant’s Amps consumption by feature.
Sources features
Sources features include the following Amps categories:
Bridge
Amps consumption for the Amperity Bridge feature is determined by:
The volume of data that is synced with Amperity
The amount of time required for each sync data and process views
The frequency of syncs
Monitor Amps consumption for the Amperity Bridge feature by:
Reviewing the aggregate number of records ingested from the Usage page
Monitoring sync times from the Workflows page
Verifying the number of times data has been synced from the Workflows page
Ingest
Amps consumption for the Ingest feature is determined by:
The frequency at which data is loaded to Amperity
The amount of time it takes to ingest data.
Time affects Amps consumption more than volume or frequency because large file formats take longer to load than partitioned files of the same size.
The use of ingest queries that preprocess data before ingest
Storage for the Ingest feature is determined by: * The volume of data that is loaded to Amperity
Monitor consumption for the Ingest feature by:
Monitoring the aggregate number of records ingested from the Usage page
Monitoring ingest runtimes from the Workflows page
Preferring file formats that are partitioned, such as Apache Parquet, over file formats that are not, such as CSV
Using Amperity Bridge to sync large volumes of data instead of loading that same volume as a flat file
Review ingest queries to help ensure they are simple and efficient. Complex or inefficient SQL within an ingest query increases Amps consumption
Configuring courier groups to ingest files only when necessary. For example, some files must be ingested daily, but others might only need to be ingested weekly or monthly
Tables
Amps consumption for the Source tables feature is determined by:
The amount of data stored in source tables and the outputs of source transforms
The number if fields in source tables
The density of records in source tables
Monitor Amps consumption for the Source tables feature by:
Monitoring the total number of records from the Sources page
Reviewing the number of records that are ingested per day from the Usage page
Transformations
Amps consumption for the Transformations feature is determined by:
The frequency at which transformations are run
The volume of data that is processed for transformations
Complex SQL in transformations may cause longer runtimes
Changes to transformations runtimes often cause variable Amps consumption
Larger compute resources
Note
Transformations are also referred to as “custom domain tables”.
Monitor Amps consumption for the Transformations feature by:
Monitoring the history of runtime durations for transformations from the Workflows page
Count the number of transformations that are run from the Workflows page
Using version history to monitor changes to SQL queries for transformations
Stitch features
Stitch features include the following Amps categories:
Stitch
Amps consumption for the Stitch feature is determined by:
Adding more inputs to Stitch, such as additional data sources that contain customer profile data, can increase Amps consumption. This is highly dependent on the types of records that are made available to Stitch. Sparse records with low connectivity will consume fewer Amps. Rich records with high connectivity will consume more Amps
Poorly configured foreign keys (FKs) can lead to higher frequencies of interconnected records, which may increase the duration of the Stitch run
Bad values that are not added to the bad-values blocklist may increase the duration of the Stitch run
Larger compute resources
Monitor Amps consumption for the Stitch feature by:
Monitoring the duration of Stitch runs from the Workflows page
Viewing the number of profiles that are stitched over time from the Usage page
Stitch configuration and Amps consumption?
Forcing Stitch to run increases Amps consumption because Stitch does not use cached results with that run mode.
Skipping unified changes output can lower Amps consumption.
Disabling stable IDs can lower Amps consumption, but also makes it more likely that Amperity ID assignment for profiles changes more often over time.
Using 1:1 Stitch has the lowest Amps consumption, but that is because Stitch does not perform identity resolution with that run option.
The size of graph partitions, also referred to as supersized clusters, can affect Amps consumption.
A high threshold at which trivial duplicates are treated as a single record can affect Amps consumption.
Stitch Report
Amps consumption for the Stitch Report feature is determined by the amount of time it takes to build the report after Stitch is done processing data for identity resolution. The amount of time it takes to build the report is determined by the complexity of the Stitch run.
Databases
Amps consumption for the Databases feature is determined by:
The frequency at which a database is run
The length of time it takes to run the database
Calculating extended transactions attributes
Larger compute settings for SQL resources
Storage for the Databases feature is determined by:
The number of tables in a database
The number of custom tables that are used by analytics and marketing activities
The number of records in each table
Monitor consumption for the Databases feature by:
Monitoring the database runtime and run history
Monitoring individual table runtimes and histories
Monitoring record counts over time by table, especially after updates are made to SQL queries
Comparing runtimes over time will help identify tables that contain inefficient or complex SQL.
Reducing cluster size may reduce Amps consumption for Spark processing, but may increase the overall runtime.
Inefficient and complex SQL will consume more Amps at a higher rate than data quantity or data complexity.
Duplication and skew in JOIN operations or window functions affects how the table is partitioned by Spark.
Analytics features
Analytics features include the following Amps categories:
BI Connect
Amps consumption for the BI Connect feature is determined by the frequency at which data is sent to BI Connect, is orchestrated from BI Connect, along with the amount of data that is stored in BI Connect.
Tip
Work with your Amperity representative to better understand your brand’s Amps consumption rates when using BI Connect.
Migrating BI Connect workflows to Amperity Bridge will lower Amps consumption.
Predictive modeling
Amps consumption for the Predictive modeling feature is determined by:
The frequency at which predictions (including training and inference) are run
The number of courier groups that are associated with predictive modeling
The number of predictive models that are enabled. Adding models increases Amps consumption.
The size of the dataset that is made available to predictive modeling.
Storage for the Predictive modeling feature is determined by:
The amount of data that is configured and made available to predictive modeling
Note
Amperity trains models every two weeks. Amps consumption for predictive modeling increases during model training.
Monitor consumption for the Predictive modeling feature by:
Monitoring workflows that contain predictive modeling tasks from the Workflows page
Reviewing the record count for tables that are used by predictive modeling
Consider the frequency at which models are run. Less frequent training or inference will lower Amps consumption, but will decrease the accuracy of the models.
Ensuring that each model has the correct inputs. Use the Predictive models page that is available for each database to review the inputs to each model in your customer 360 database
Review each predictive modeling job, including when the next inference and training jobs runs. Use the Predictive models page to access individual jobs for each predictive model that is enabled in your tenant
Queries
Amps consumption for the Queries feature is determined by:
The number of ad-hoc queries
The complexity of each query as measured by the number of bytes scanned
The size of the dataset that is available to the query
Monitor Amps consumption for the Queries feature by:
Monitoring the number of queries that are executed from the Usage page
Verifying the amount of data scanned by a query
Review Spark SQL queries with high Amps consumption for skew.
Segments
Amps consumption for the Segments feature is determined by:
The number of tracked segments that are run
The complexity of tracked segments as measured by the number of bytes scanned
Spark SQL sessions
Amps consumption for the Spark SQL sessions feature is determined by:
The size of the compute settings for the Spark SQL session
The number of Spark SQL sessions that are run
The length of each session
Activation features
Activation features include the following Amps categories:
Audiences for campaigns
Amps consumption for the Campaigns feature is determined by:
The frequency at which campaigns are run
The complexity of SQL queries that are used by a campaign
The number of individual segments that are run within each campaign. A campaign starts with a top-level audience, applies exclusions, uses additional segments to apply subaudiences by destination and use case, then finally appends relevant fields to the output. Each segment that is run within a campaign will consume Amps
The amount of data being sent from Amperity to a downstream location
Storage for the Campaigns feature is primarily determined by:
The size of the campaigns activation state and Campaign Recipients tables
Monitor consumption for the Campaigns feature by:
Reviewing audience sizes. Larger segments take longer to analyze and campaigns that have more subaudiences, criteria, or configured attributes takes longer to run and will consume more Amps
Monitoring workflows that contain recurring campaigns from the Workflows page
Monitoring the frequency and runtime duration for campaigns that are run automatically from the Usage page
Reviewing the customer profiles and records sent from the Usage page
Limiting the number of records that are maintained in the campaigns activation state and Campaign Recipients tables by ensuring that campaigns sent from Amperity are actively used by your brand’s downstream use cases
Audiences for journeys
Amps consumption for the Journeys feature is determined by:
The frequency at which journeys are run
The complexity of SQL queries that are used by a journey
The frequency at which audiences are split into different pathways within a journey
The number of individual segments that are run within each journey
The size of each audience within the journey
Monitor consumption for the Journeys feature by:
Reviewing audience sizes. Larger segments take longer to analyze and journeys that have many branching paths takes longer to run and will consume more Amps
Limiting the number of records that are maintained in the journeys activation state table by ensuring that journeys sent from Amperity are actively used by your brand’s downstream use cases
Audiences for orchestrations
Amps consumption for the Orchestrations feature is determined by:
The frequency at which orchestrations are run
The complexity of SQL queries that are used with each orchestration
The amount of data being sent from Amperity to a downstream location
Monitor Amps consumption for the Orchestrations feature by:
Monitoring workflows that contain queries that are run automatically from the Workflows page
Monitoring the frequency and runtime duration for queries that are run automatically from the Usage page
Data sent to cloud storage
Amps consumption for cloud storage–Amazon S3, Google Cloud Storage, Microsoft Azure, and SFTP–is determined by the amount of data sent from Amperity cloud storage.
Note
Amps consumption for data sent to managed connectors is its own category.
Monitor Amps consumption for cloud storage by:
Reviewing the size of datasets
Reviewing the number of records sent
Monitoring the frequency at which data is sent to cloud storage
Data sent to managed connectors
Amps consumption for managed connectors–campaigns, journeys, and orchestrations–is determined by the amount of data sent from Amperity to downstream marketing applications.
Note
Data sent to cloud storage is its own Amps category.
Monitor Amps consumption for managed connectors by:
Reviewing campaign audience sizes
Monitoring the frequency at which campaigns and journeys run
Reviewing customer profiles
Reviewing the number of records sent in orchestrations
Profile API
Amps consumption for the Profile API feature is determined by the number of individual Profile API indexes that are enabled in your tenant. Each index is made available from an endpoint that is always available to downstream workflows that make API requests to that endpoint.
Monitor Amps consumption for the Profile API feature by ensuring that your tenant generates Profile API indexes that are necessary to support your downstream workflows.
Reduce Amps consumption
You should review your Amps consumption on a regular basis to ensure that your brand is getting the most value out of Amperity to support all of your brand’s use cases.
Tip
Use Amp Insights to quickly investigate consumption patterns, such as identifying what caused a spike or which campaigns consume the most Amps.
By category
The following sections describe approaches your brand can take to help optimize your Amps consumption by category: Activation, Analytics, Databases, Sources, and Stitch.
Activation
To reduce Amps consumption for the Activation category:
Review SQL used in orchestrated queries. Complex operations over large datasets tend to consume more Amps.
Review segments used for campaigns. Complex operations over large datasets tend to consume more Amps.
Analytics
To reduce Amps consumption for the Analytics category:
Predictive modeling can have a high Amps consumption rate, especially on days where the models are being trained against your customer data profiles. Ask your Amperity representative for assistance with adjusting compute resourcing for predictive modeling.
Databases
To reduce Amps consumption for the Databases category:
Databases and source transforms run on Apache Spark and use Spark SQL. Review the run history to identify the longest-running tables.
Complex SQL over large datasets tends to consume more Amps. Consider opportunities to simplify the logic and filter or pre-aggregate incoming data.
Spark performance suffers in the presence of “skew”, or poorly distributed data that is used for joins, aggregations, or window function partitions. Check the distribution of values used in joining keys.
Duplication in joins can result in higher Amps consumption, as later operations must process a larger amount of data. Check for uniqueness in joining keys, and consider aggregating before joining to prevent duplication.
Review compute settings. Ask your Amperity representative for assistance with adjusting compute resourcing for the Databases category.
Sources
To reduce Amps consumption for the Sources category:
Use Amperity Bridge to sync data to Amperity. A sync is more efficient and typically consumes Amps at a lower rate than loading files. Amperity Bridge efficiently connects to your Lakehouse.
Partitioned CSV files, when available, can be ingested in parallel, running faster than non-partitioned CSV files. Modern file formats, such as Apache Parquet, can be processed faster.
Ingesting data incrementally is faster than ingesting full historical data.
Remove unused source tables. The amount of data that is stored will consume Amps. While storage costs do not typically lead to high Amps consumption, deleting unused source tables can help reduce Amps consumption.
Note
Amperity maintains a short buffer period to ensure data can be restored, should it need to be. After deleting unused source tables lower Amps consumption shows in the dashboard after the buffer period has been passed.
Remove older records. Processing smaller tables consumes fewer Amps.
Source transforms (previously referred to as “custom domain tables”) can be difficult to optimize. Refer to the Database section for tips on how to improve Spark SQL performance, or ask your Amperity representative for assistance.
Stitch
To reduce Amps consumption for the Stitch category:
Review bad-value blocklist settings. Bad values can lead to overclustering, and increased Amps consumption.
Review all of the foreign keys (FKs) that are applied to all source tables that are made available to Stitch. Poorly configured foreign keys (FKs) can lead to higher frequencies of interconnected records, which may increase the duration of the Stitch run and lead to higher Amps consumption. Consider adding automated bad-value detection for foreign keys.
As your brand adds more records Amps consumption will change. More complete records typically consume more Amps than sparse records. Depending on the type of data added, it may be helpful to adjust the compute resourcing. Ask your Amperity representative for assistance with adjusting compute resourcing for the Stitch category.
Adjust compute settings
Compute settings control the amount of compute resources, such as CPU and memory, that are available to a category. Increasing compute resource sizes increases the rate at which Amps are consumed per hour. This rate varies by feature and may be affected by other configurations within your tenant. Ask Amperity Support for assistance with questions before adjusting compute resources.
You can adjust the compute settings for your tenant for the following categories:
Source transforms
Stitch
Databases
Stitch reports
Spark SQL engine
Compute settings for each category may be adjusted to one of XS (smallest), S, M, L, XL, and XXL (largest). Open the Compute settings page from the Amperity menu (next to your tenant’s brand logo), use the sliders to adjust the compute resource size, and then click Save
Note
The compute resources for the Ingest category cannot be adjusted because ingest dynamically scales to the type and amount of data that is being pulled into the Amperity platform.
Fine-tuning compute resource sizes is a balance between speed and cost. For well-distributed jobs, increasing compute resources might reduce runtime while consuming Amps at the same rate. For inefficient SQL operations, increasing compute resources may increase Amps consumption, without significant runtime reduction. All changes to compute resources should be made in a sandbox and fully tested before promoting them to your production tenant.
Important
Only a Datagrid Administrator can modify compute resource sizes. Ask your Amperity representative for assistance with any questions around adjusting compute resources.