About data lineage
Data lineage is a graph visualization that shows how all of the data within your tenant connects. The graph visualization is refreshed each time a user loads the Data lineage page.
You can access the data lineage view the following ways:
On the top of the Sources page click Data lineage. On screens with lower resolutions click the Tools menu, and then click Data lineage.
On the top of the Customer 360 page, click Data lineage.
From the Actions menu for courier groups, couriers, custom domain tables, feeds, inbound shares, and source domain tables.
From the Data Explorer.
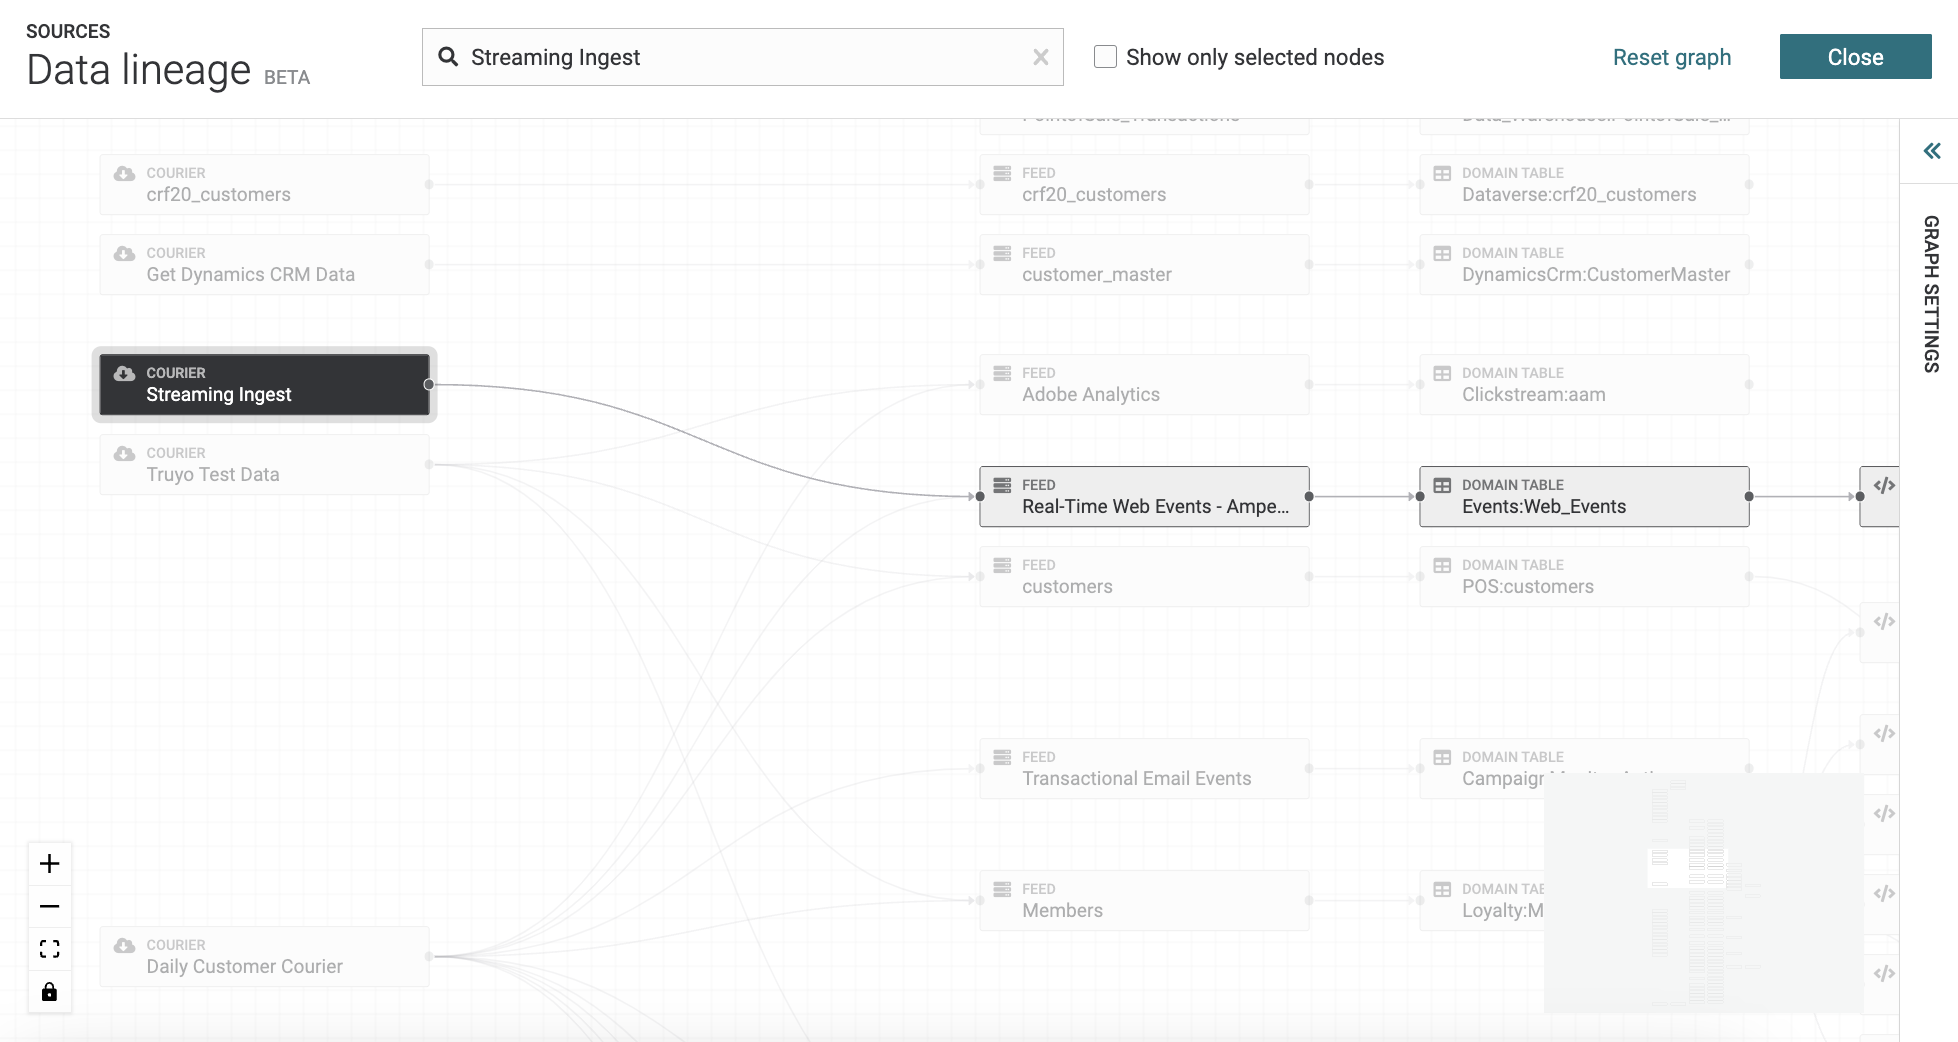
This opens the full graph and all data sources (nodes) are visible as starting nodes in the graph. Click any data source to explore how data moves from that data source into domain and database tables. Click any table to see its relationship to other tables and the sources from which rows in that table originate.
Search for data sources (nodes), by entering search criteria in to the search field at the top of the page. You can see hide tables from the graph by selecting the Show only selected nodes checkbox.
Note
To reset the graph, click Reset graph on the top of the page.
Change the graph settings by clicking on the Graph Settings panel to open it on the right-side of the page. Use the layout options to change the color theme, graph direction, node width, vertical spacing, and horizontal spacing for the graph. You can reset the graph settings by clicking Reset on the Graph Settings panel. To close the panel click on the arrows at the top of the panel.
Tip
Use the view options to zoom in and out on the nodes by clicking the plus sign to zoom in and the minus sign to zoom out. You can also reset the view by clicking the box option and lock and unlock the graph by clicking the lock option.