
Build queries
Sending data from Amperity is a combination of three things: building a query, linking the results of that query to an orchestration that sends the results to a destination, and then monitoring the workflow to ensure that your data safely makes it downstream.
This is part one of a series of topics that describes how this works.
Build queries using Presto SQL. A SELECT statement, along with standard clauses, operators, and functions, is all you need to return data that support any use case.
An orchestration connects the results of your query to a workflow that sends those results to its destination.
A workflow manages the process of sending that data to the selected destination.
Note
Each workflow is monitored by Amperity. You may see notifications about the state of the workflow within the Queries and Destinations pages. Depending on the type of notification, you may be directed to a workflow actions page that will actively help you troubleshoot issues within that workflow.
The visual Query Editor is a user interface within the Queries page that helps you build queries without having to write SQL. The SQL Query Editor is a SQL interface in which you can support any use case by writing SELECT statements using Presto SQL.

|
The SQL Query Editor is available on the Queries page. Click the Create button in the top right corner, and then choose SQL Query. |

|
You may use any table in any database to build a query. Your customer 360 database should already be selected for you (by default), though it is possible to have more than one 360 database available to the SQL Query Editor. Expand each of the table rows to see the attributes that are available from that table. Open the Data Explorer to view detailed information about every table and every attribute, including examples of the values they contain. 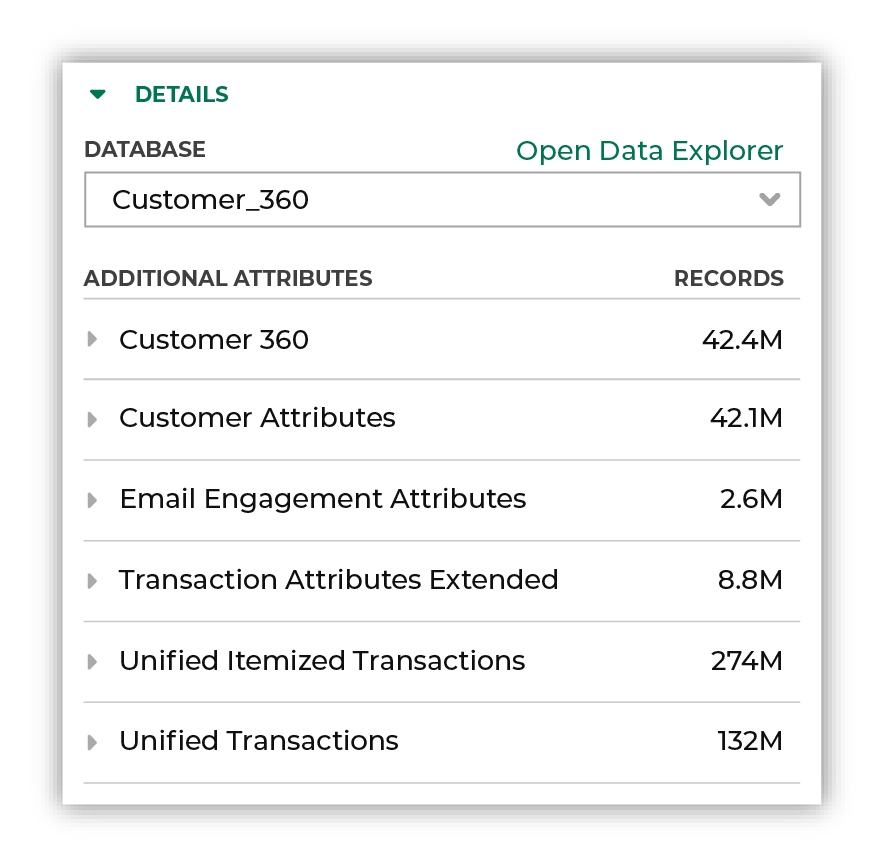
|

|
Start building your query by writing a SELECT statement using Presto SQL that accesses the tables in your customer 360 database. The query that you build will depend on your goals and your use case. The following query returns three values for each month in a calendar year: revenue for customers who are in your top 20 percent, total revenue, and the percent of total revenue your top 20 percent customers represent. SELECT
month
,SUM(CASE
WHEN top_20
THEN revenue
ELSE NULL
END) revenue
,SUM(revenue) total_revenue
,1.00*SUM(CASE
WHEN top_20
THEN revenue
ELSE NULL
END)/SUM(revenue) percent
FROM (
SELECT
month
,amperity_id
,revenue
,CASE
WHEN rank IN (9,10) THEN TRUE
ELSE FALSE
END AS top_20
FROM (
SELECT
MONTH(order_datetime) AS month
,amperity_id
,SUM(order_revenue) revenue
,NTILE(10) OVER (ORDER BY SUM(order_revenue)) rank
FROM Unified_Transactions
WHERE YEAR(order_datetime)=2022
GROUP BY 1,2
)
)
GROUP BY 1
ORDER BY month ASC
|

|
Click Run Query to run the query. The syntax for the attributes you added to the query are validated, after which the results are shown in the lower part of the SQL Query Editor. The results will show you a list of columns, one for each attribute that was returned by the query. In this example, four columns are returned: order_month, top_20_revenue, total_month_revenue, and top_20_percent_revenue. The results are similar to: ------- ------------- --------------- ----------
month revenue total_revenue percent
------- ------------- --------------- ----------
1 52201487.51 144137695.60 0.362164
2 50893203.32 142132298.13 0.358069
3 41257843.42 121747802.99 0.338879
4 43616719.20 126389526.45 0.345097
5 75123545.83 188169441.30 0.399233
6 37406903.31 112992544.71 0.331056
7 40533591.78 120249271.98 0.337079
8 41941599.44 123349972.21 0.340021
9 44461258.48 128513319.04 0.345966
10 48251130.38 136503680.65 0.353478
11 96664540.49 225473807.02 0.428717
12 301944067.23 498955371.34 0.605152
------- ------------- --------------- ----------
|

|
Give your query a name a clear and understandable name. The name field is located in the upper left corner of the SQL Query Editor. Tip Use good naming patterns to ensure that you can always find your queries when you need them. Add details like “historical”, “daily”, or “test” as appropriate. Be sure to include the brand name and/or the region name if you have multiple brands or have multiple regions. Some examples:
Prefix a query that is located in a folder with that folder name as often as possible. For example, if you have a folders named “Tableau” use query names like “Tableau_Yearly_Revenue_by_Month” for all queries that exist within that folder. |

|
When you are done building your query, click the Activate button in the top right corner of the SQL Query Editor. |