
Recency, frequency, monetary
RFM is a method used to analyze customer value that represents three dimensions:
Recency. How recently did the customer purchase?
Frequency. How often does the customer purchase?
Monetary. How much does the customer spend?
Individual scores for recency, frequency, and monetary have a scale of 1-10. Combined RFM scores exist on a scale. “111” represents the lowest possible RFM score. “101010” represents the highest possible RFM score, or “three ‘10’ scores”. Higher scores represent preferred behaviors.
RFM scores
RFM scores are available as out-of-the-box attributes in Amperity standard output. These attributes – L12M Recency, L12M Frequency, and L12M Monetary – can be found in the Transaction Attributes Extended table and are built from historical data for the previous 12 months. Use the scores in these attributes to quickly build useful audiences around how much your customers spend, how often they purchase, and how recently they purchase.
Note
RFM scores, because they are historically-based and only cover a rolling 1-year window, are generally less accurate than (p)CLV attributes, which is available when you enable Amperity predictive analytics in your tenant. (p)CLV attributes provide better answers than RFM scores for the following questions: “How much will customers spend in the next year?” and “Which customers are your most valuable customers?”
RFM percentiles
Each RFM score is split into ten percentile groups. The lowest percentile is 1 and the highest percentile is 10. Each percentile represents 10% of the customers who belong to that segment.
10 represents the 90-100th percentile and the customers who have the highest recency, frequency, or monetary scores.
9 represents the 80-90th percentile
8 represents the 70-80th percentile
7 represents the 60-70th percentile
6 represents the 50-60th percentile
5 represents the 40-50th percentile
4 represents the 30-40th percentile
3 represents the 20-30th percentile
2 represents the 10-20th percentile
1 represents the 0-10th percentile and the customers who have the lowest recency, frequency, or monetary scores.
Tip
Combine percentiles to build larger groups of customers. For example 9 and 10 together represent the “top 20%” while 8, 9, and 10 represent the “top 30%”.
Example: Top 20% revenue during the previous year
Which customers are your top 20-percent for revenue during the previous year?
Use the monetary component of approximate RFM scores to quickly find customers who are in the top 20-percent, along with the percentage of total revenue those customers represent.
Tip
Divide percentage of revenue by the number of customers in the top 20 to find the average percentage of revenue that is generated by each customer across all of your brands, stores, channels, and regions.
The following sections describe using the Segment Editor to build a segment that finds your top 20-percent customers for revenue in the previous year.

|
Open the Segment Editor, look in the lower-right of the page and make sure your customer 360 database is selected. 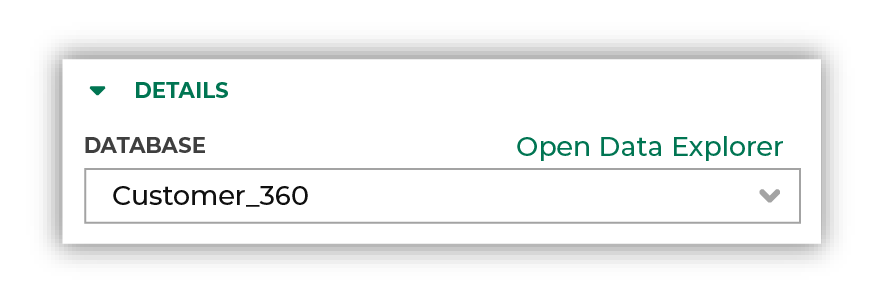
|
|
To identify customers who are in your top 20-percent for revenue during the previous year, choose the L12M Monetary attribute from the Transaction Attributes Extended table, select the “is in list” operator, and then select “9” and “10”: 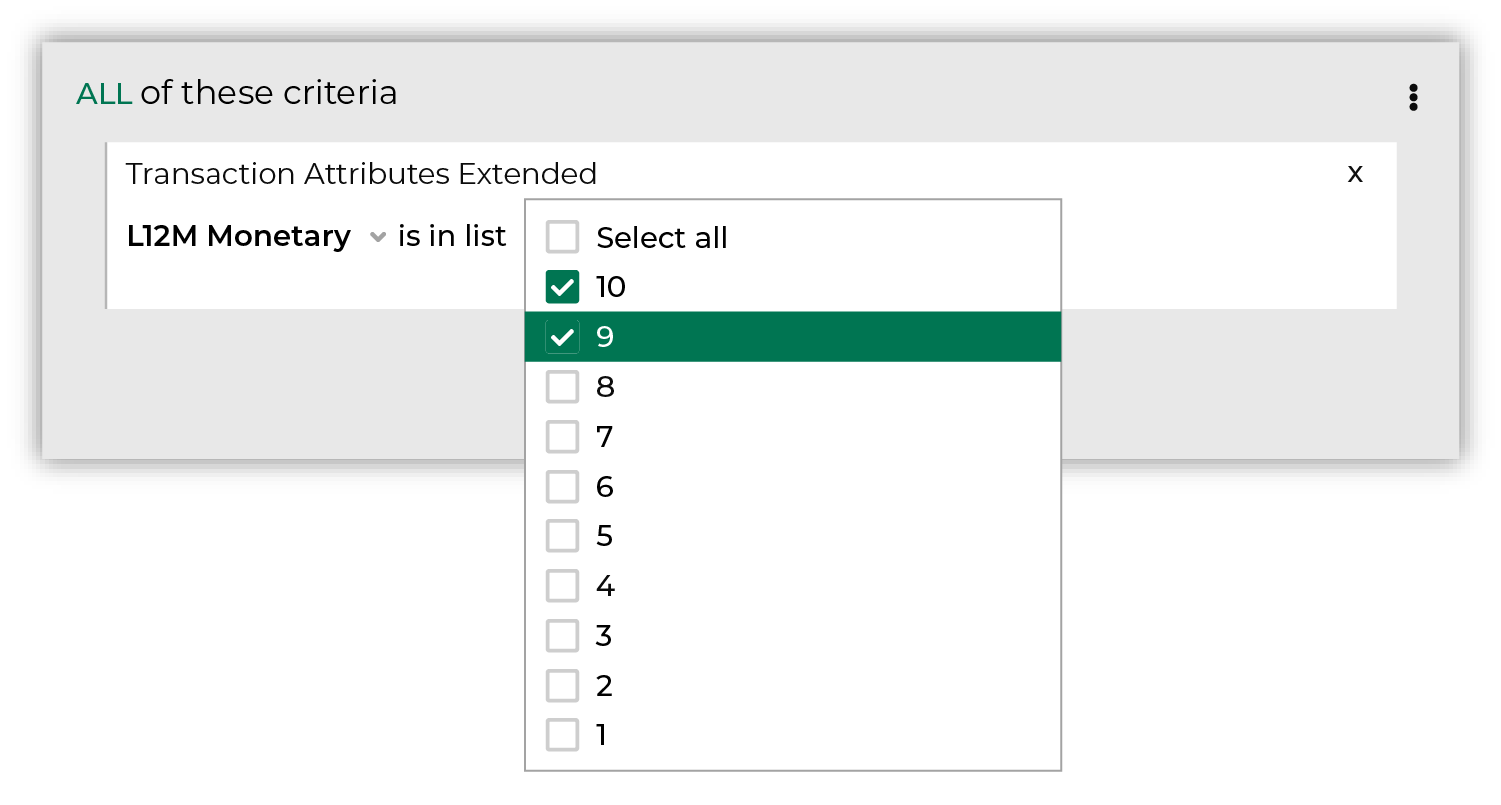
Click the Refresh button located on the right side of the Segment Editor to see how many customers are in your segment, how much they spent in the past year, how many are active, and how many of them could belong to a future campaign. The active customers insight shows you how many customers are in the top 20-percent. The segment revenue insight shows you what percentage of your total revenue those customers represent. 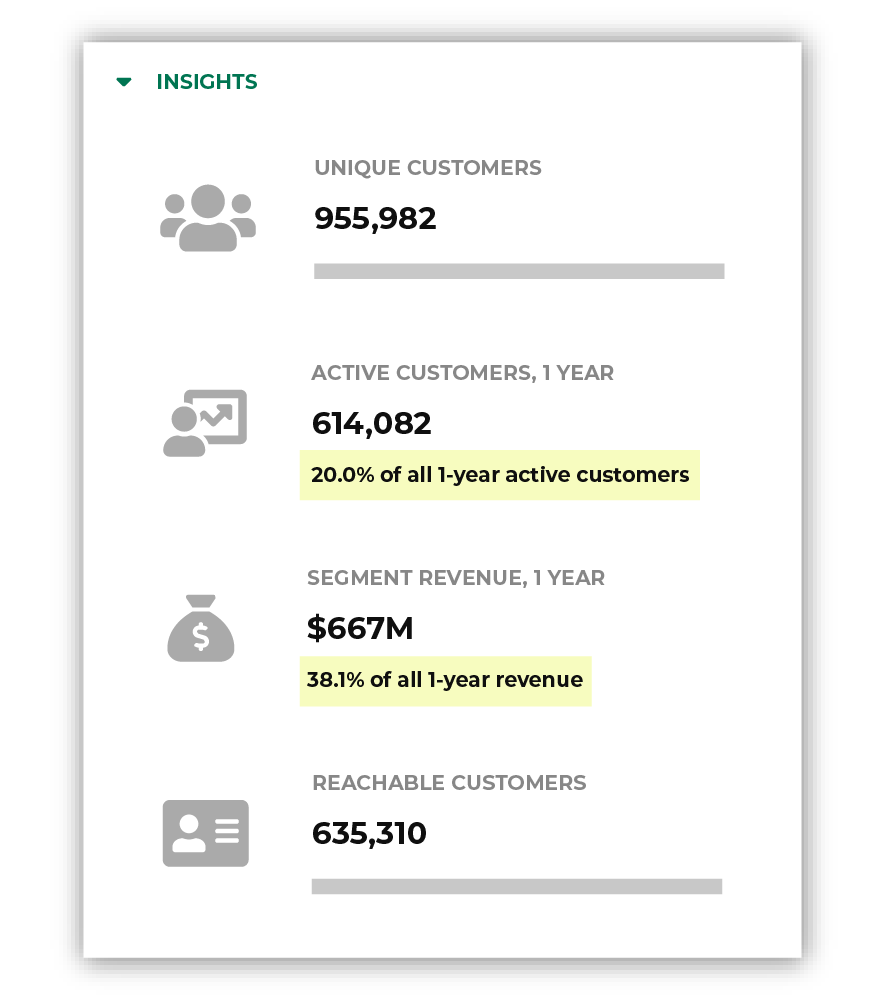
|
|
You’re done! Click the Save As button in the top right corner of the Segment Editor. Give your segment a name that clearly describes the purpose and audience type for the segment. For example: “Top 20 Percent Customers During Previous Year”. 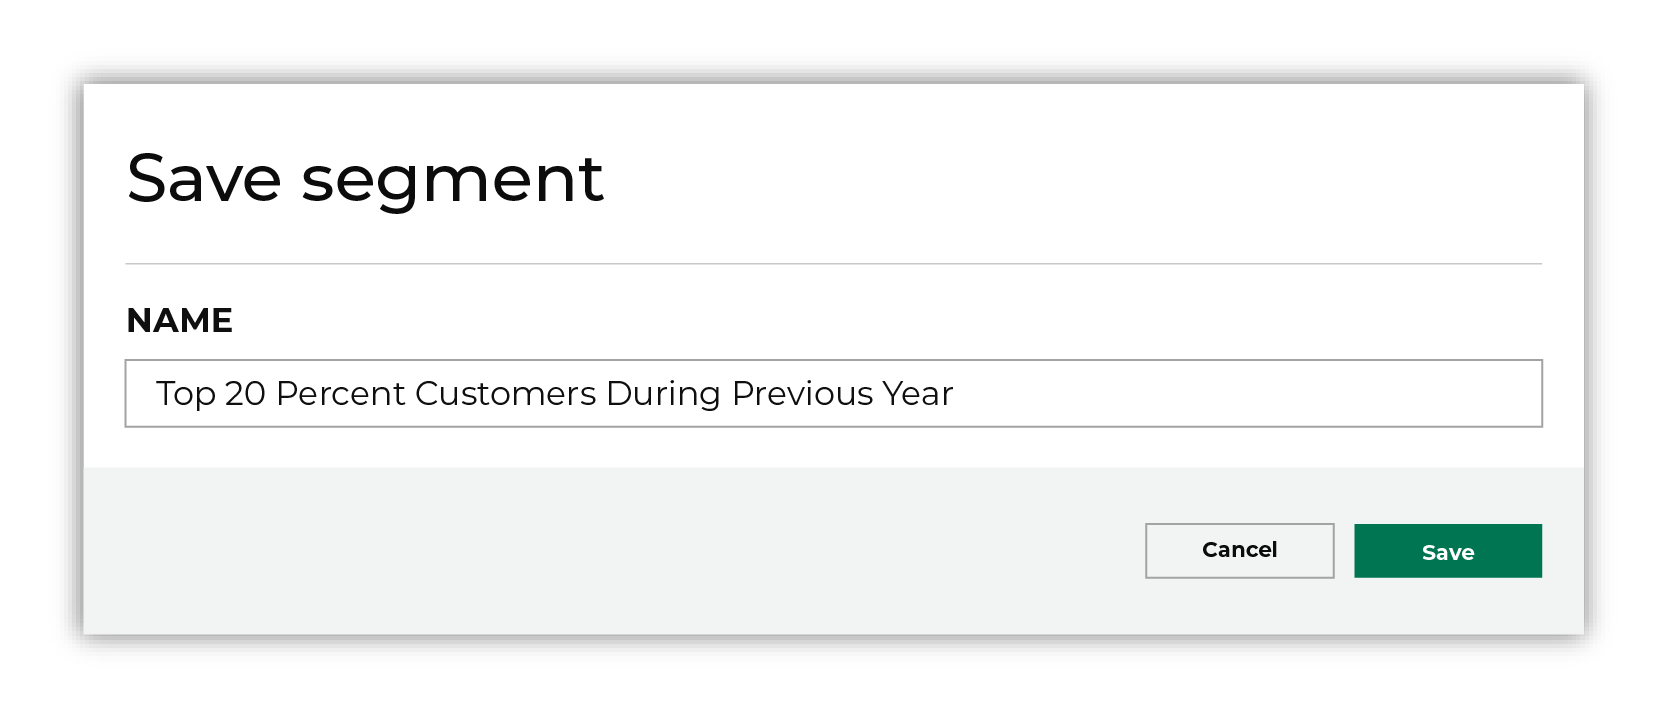
Tip Use good naming patterns to ensure that you can always find your segments when you need them. Be sure to include the brand name and/or the region name if you have multiple brands or have multiple regions and want to build segments that are brand- and/or region-specific. |
|
After your segment is saved the Segment Overview page opens and shows additional details, such as historical and predicted revenue, the percentage of customers that are reachable by email, by phone, on Facebook, and customer trends, such as purchases by channel, revenue by lifetime spend. |
Can you combine RFM attributes?
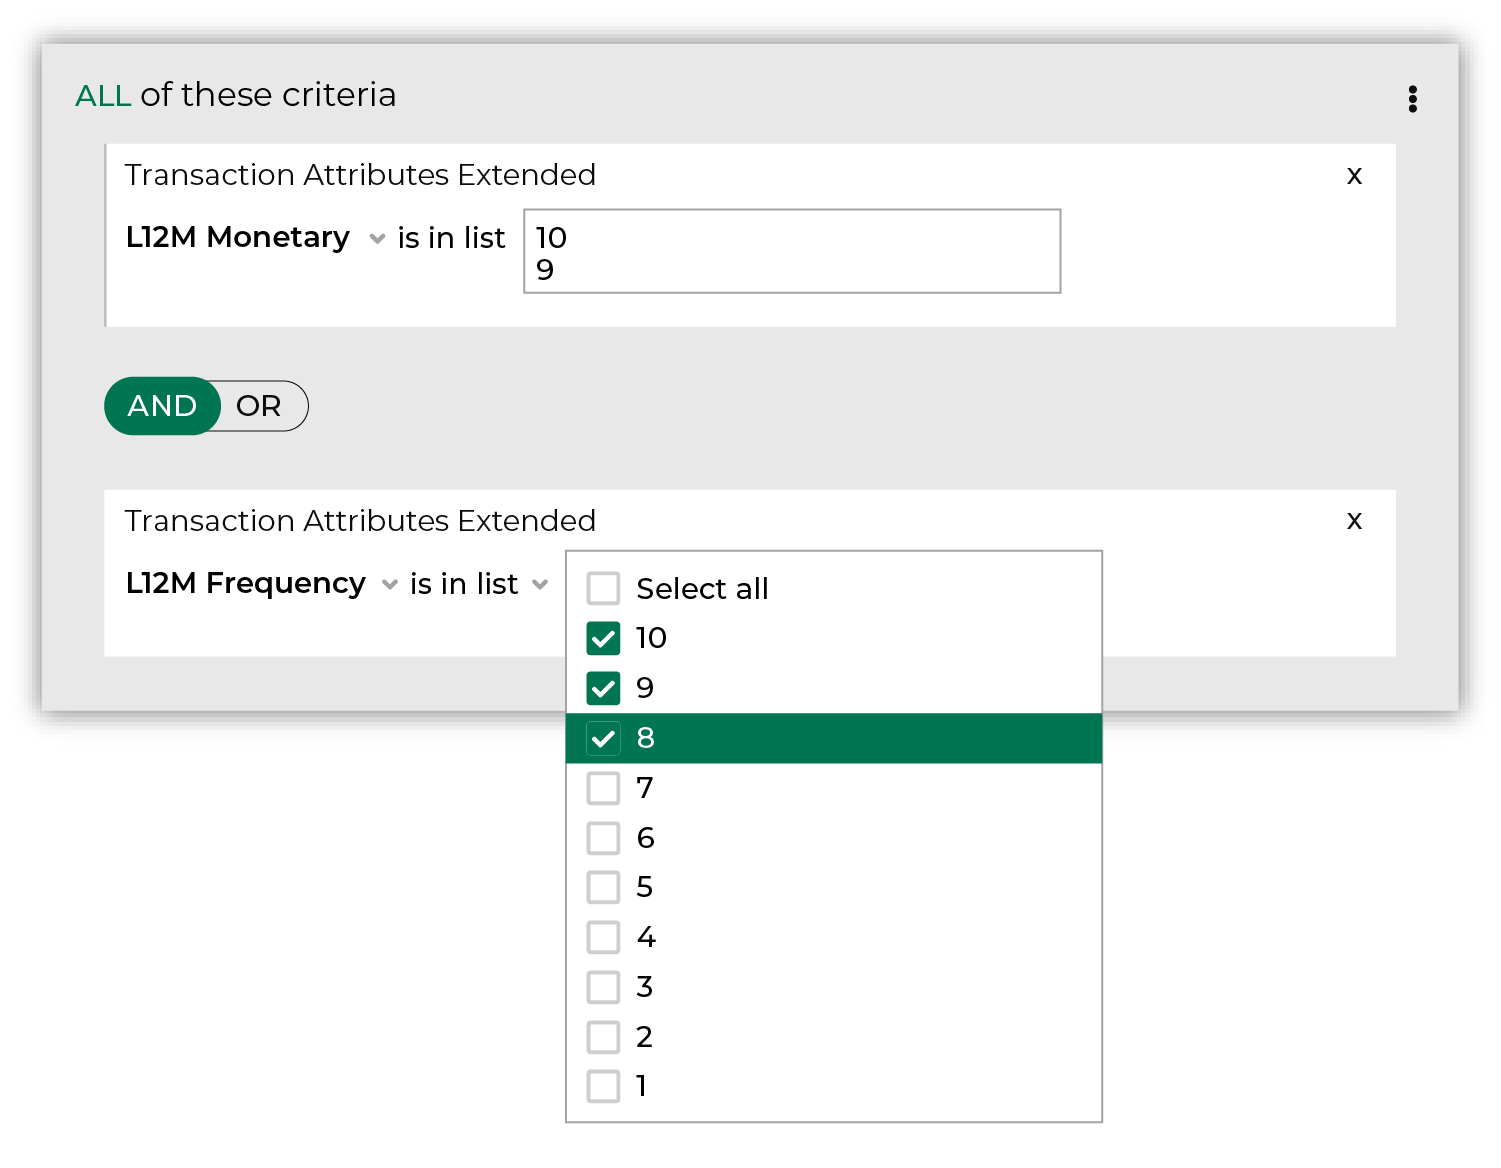
Yes. For example, you can extend the top 20% revenue list to also include customers who are in your top-30 percent for purchase frequency.
Click + Add Attribute, choose the L12M Frequency attribute from the Transaction Attributes Extended table, select the “is in list” operator, and then select “8”, “9”, and “10”:
How combined RFM scores work
A combined RFM score returns a list of customers who meet the requirement for each individual RFM score, i.e. recency AND frequency AND monetary. An RFM score of “9810” represents three individual scores. The following diagram shows individual RFM scores for individual recency (“9”), frequency (“8”), and monetary (“10”). The darker color represents the scores:
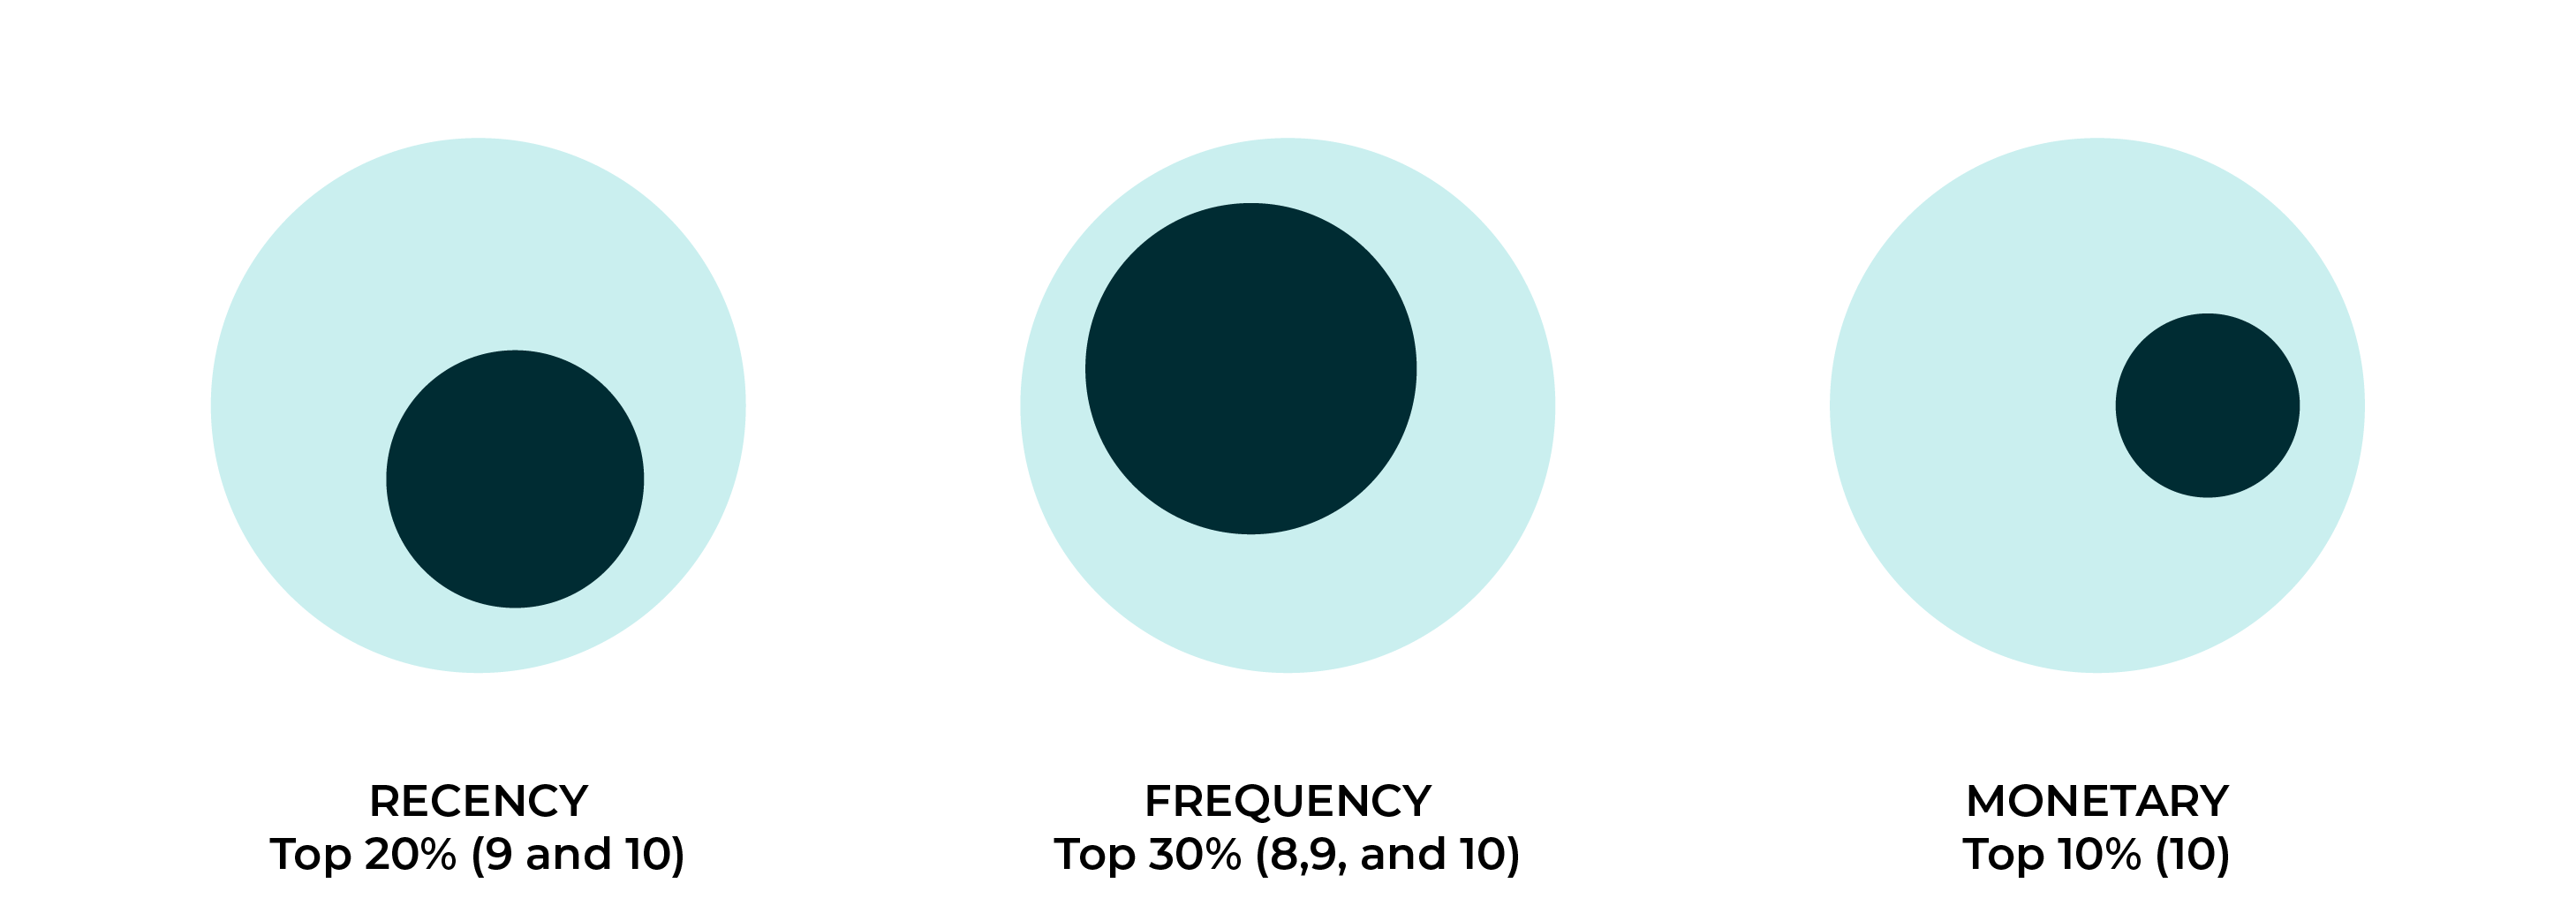
The combined score returns customers who met each requirement. This is often a much smaller list of customers than each individual RFM score and is not a percentile. The following diagram shows the overlap and the white section represents the much smaller list of customers who met each of the individual RFM scores.

More scenarios
The following sections don’t walk through how to configure attributes in the Segment Editor, but they do describe situations in which using RFM scores can help you build useful audiences for your campaigns.
Direct mail campaigns
RFM scores were originally designed to support direct mail campaigns in the pre-digital age. RFM metrics can help you identify future customer behavior. A customer who has purchased recently is more likely to purchase again. A customer who has visited your website (and interacted with your brand) is more likely to visit again. A customer who spends a lot of money is more likely to keep spending a lot of money.
Direct mail provides a physical touchpoint that can help you make a positive impression on your customers. Many direct-to-consumer companies prefer direct mail campaigns because there are more formats and approaches that you can use to accurately represent your brand.
With the right audiences targeted correctly, you can use RFM analysis to help your direct mail campaign stand out in the age of pervasive digital advertising and overflowing email inboxes.
Use RFM scores to identify households that are more likely to be receptive to the messages you want to include in your direct mail campaigns.
High F, low R scores
A high frequency score and low recency score represents a customer who has recently stopped buying from your brand. Use this combination of scores as an indicator for customers who may require special offers to entice them back to spending money with your brand.
High M, low F scores
A high monetary score and low frequency score represents a customer who spends a lot of money, but shops infrequently.
For example, a customer may buy tractor and lawnmower supplies from a tractor supply company in the early spring to prepare for the seasonal upkeep of their small farm.
RFM analysis can help you identify this customer and build campaigns around loyalty programs and special summer sales. Use high monetary scores as an indicator for customers who do not require discounts.
High R, low F and M scores
A high recency score combined low frequency and monetary scores will build an audience of new customers who probably won’t spend a lot of money in the future. Use this combination of scores as an indicator for customers that might respond to special offers, but consider the low spend to be an indicator of customers who may have a low response rate to more typical marketing campaigns.
High R and F, low M scores
High recency and frequency scores combined with a low monetary score will build an audience of active customers who purchase frequently, but do not spend a lot of money.
Use this combination of scores as an indicator for customers who should not receive discounts. These customers already shop regularly, the challenge is growing their spend. Use cross-sell and upsell campaigns to improve spend amounts and consider inviting customers who respond to those campaigns into your loyalty program.